

doi: 10.1021/bi100238r.
Crystallographic and single-crystal spectral analysis of the peroxidase ferryl intermediate
Affiliations
- PMID: 20230048
- PMCID: PMC3202969
- DOI: 10.1021/bi100238r
Item in Clipboard
Crystallographic and single-crystal spectral analysis of the peroxidase ferryl intermediate
Biochemistry.
.
Abstract
The ferryl [Fe(IV)O] intermediate is important in many heme enzymes, and thus, the precise nature of the Fe(IV)-O bond is critical in understanding enzymatic mechanisms. The 1.40 A crystal structure of cytochrome c peroxidase Compound I has been determined as a function of X-ray dose while the visible spectrum was being monitored. The Fe-O bond increases in length from 1.73 A in the low-X-ray dose structure to 1.90 A in the high-dose structure. The low-dose structure correlates well with an Fe(IV) horizontal lineO bond, while we postulate that the high-dose structure is the cryo-trapped Fe(III)-OH species previously thought to be an Fe(IV)-OH species.
Figures

Single crystal spectra of CCP Compound I as a function of x-ray dose. Prior to x-ray exposure the spectrum is identical to the solution spectrum of Compound I. The estimated percentage of Compound I remaining in the crystal as a function of x-ray dose in panel B was based on the decrease in the absorbance peak at 634 nm.
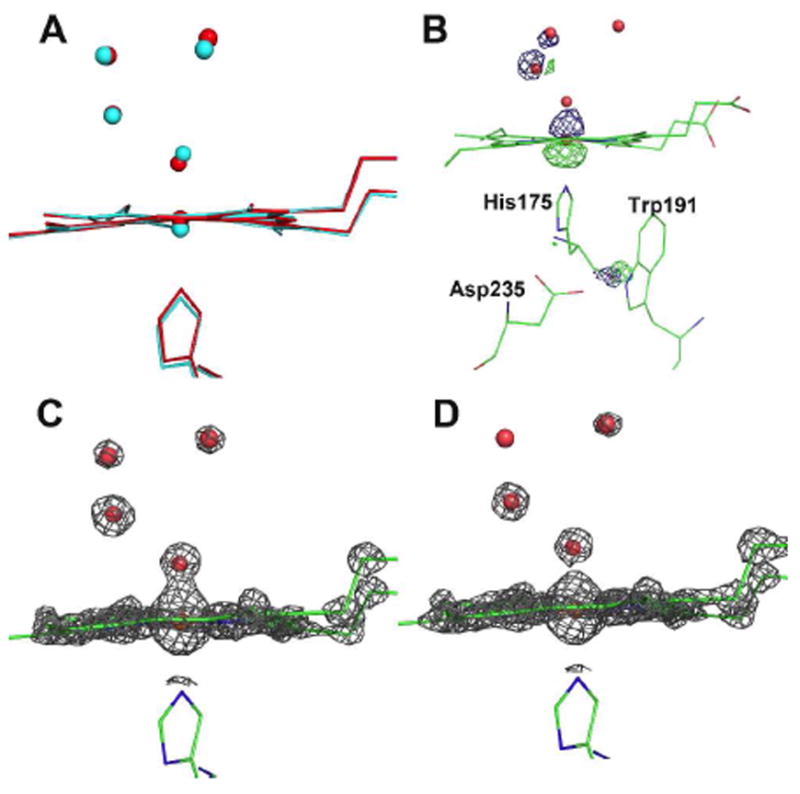
A) Superposition of the low dose structure (red) on the Fe(III) structure (cyan). Note that the iron is displaced below the plane of the heme in the Fe(III) structure and above the plane of the heme in the low dose structure; B) Fo(low dose)-Fo(high dose) electron density difference map using phases obtained from the low dose structure. The map is contoured at -5.0σ (green) and +5.0σ (blue); C and D) 2Fo-Fc electron density maps contoured at 4.0σ for the dose data set 1 (panel C) and high dose data set 15 (panel D). Oxygen and water molecules are represented by the small spheres.

Plot of the Fe-O distance as a function of x-ray dose. Each of the 13 structures was refined exactly the same way using the same starting structure and two different protocols. In the first the distances between the Fe and N atoms (4 pyrrole and 1 His closed circles) were restrained while in the second protocol no restraints were applied (open circles). At no time were restraints imposed on the Fe-O distance. The estimated error in the Fe-O bond distance is ≈0.017Å (see Supporting Information).
Similar articles
-
Heme enzymes. Neutron cryo-crystallography captures the protonation state of ferryl heme in a peroxidase.Science. 2014 Jul 11;345(6193):193-7. doi: 10.1126/science.1254398. Epub 2014 Jul 10. Science. 2014. PMID: 25013070
-
High-resolution crystal structures and spectroscopy of native and compound I cytochrome c peroxidase.Biochemistry. 2003 May 20;42(19):5600-8. doi: 10.1021/bi034058c. Biochemistry. 2003. PMID: 12741816
-
Application of Badger's rule to heme and non-heme iron-oxygen bonds: an examination of ferryl protonation states.J Am Chem Soc. 2006 Feb 15;128(6):1902-6. doi: 10.1021/ja054074s. J Am Chem Soc. 2006. PMID: 16464091
-
On the status of ferryl protonation.J Inorg Biochem. 2006 Apr;100(4):448-59. doi: 10.1016/j.jinorgbio.2005.12.019. Epub 2006 Feb 28. J Inorg Biochem. 2006. PMID: 16500711 Review.
-
Structural analysis of compound I in hemoproteins: study on Proteus mirabilis catalase.Biochimie. 1997 Nov;79(11):667-71. doi: 10.1016/s0300-9084(97)83500-6. Biochimie. 1997. PMID: 9479449 Review.
Cited by
-
Synthetic Fe/Cu Complexes: Toward Understanding Heme-Copper Oxidase Structure and Function.Chem Rev. 2018 Nov 28;118(22):10840-11022. doi: 10.1021/acs.chemrev.8b00074. Epub 2018 Oct 29. Chem Rev. 2018. PMID: 30372042 Free PMC article. Review.
-
A nearly on-axis spectroscopic system for simultaneously measuring UV-visible absorption and X-ray diffraction in the SPring-8 structural genomics beamline.J Synchrotron Radiat. 2016 Jan;23(1):334-8. doi: 10.1107/S1600577515018275. Epub 2016 Jan 1. J Synchrotron Radiat. 2016. PMID: 26698082 Free PMC article.
-
Goniometer-based femtosecond crystallography with X-ray free electron lasers.Proc Natl Acad Sci U S A. 2014 Dec 2;111(48):17122-7. doi: 10.1073/pnas.1418733111. Epub 2014 Oct 31. Proc Natl Acad Sci U S A. 2014. PMID: 25362050 Free PMC article.
-
A Noncanonical Tryptophan Analogue Reveals an Active Site Hydrogen Bond Controlling Ferryl Reactivity in a Heme Peroxidase.JACS Au. 2021 Jul 26;1(7):913-918. doi: 10.1021/jacsau.1c00145. Epub 2021 May 14. JACS Au. 2021. PMID: 34337604 Free PMC article.
-
Macromolecular crystallography and biology at the Linac Coherent Light Source.J Synchrotron Radiat. 2025 May 1;32(Pt 3):548-566. doi: 10.1107/S1600577525002735. Epub 2025 Apr 23. J Synchrotron Radiat. 2025. PMID: 40266725 Free PMC article.
References
Publication types
MeSH terms
Substances
Grants and funding
LinkOut - more resources
Full Text Sources
Medical
