

MMP-2/TIMP-2/TIMP-4 versus MMP-9/TIMP-3 in transition from compensatory hypertrophy and angiogenesis to decompensatory heart failure
- PMID: 20230216
- PMCID: PMC2879167
- DOI: 10.3109/13813451003652997
MMP-2/TIMP-2/TIMP-4 versus MMP-9/TIMP-3 in transition from compensatory hypertrophy and angiogenesis to decompensatory heart failure
Abstract
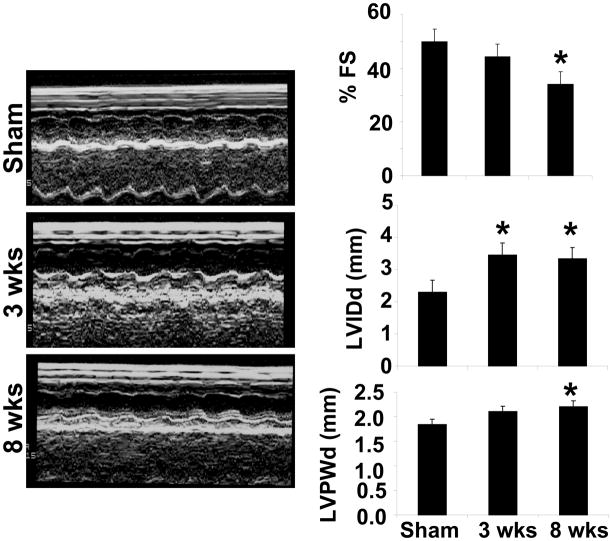
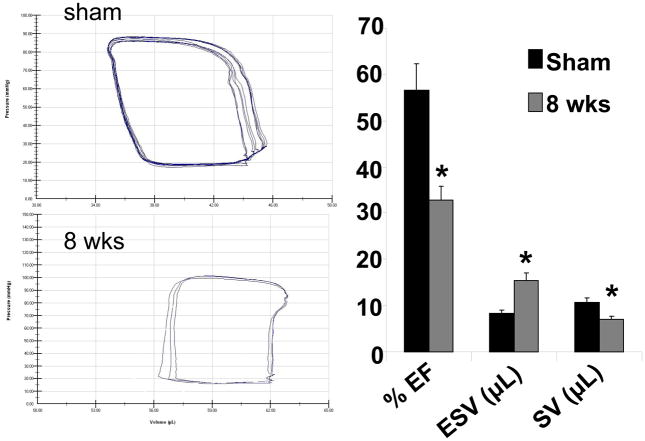
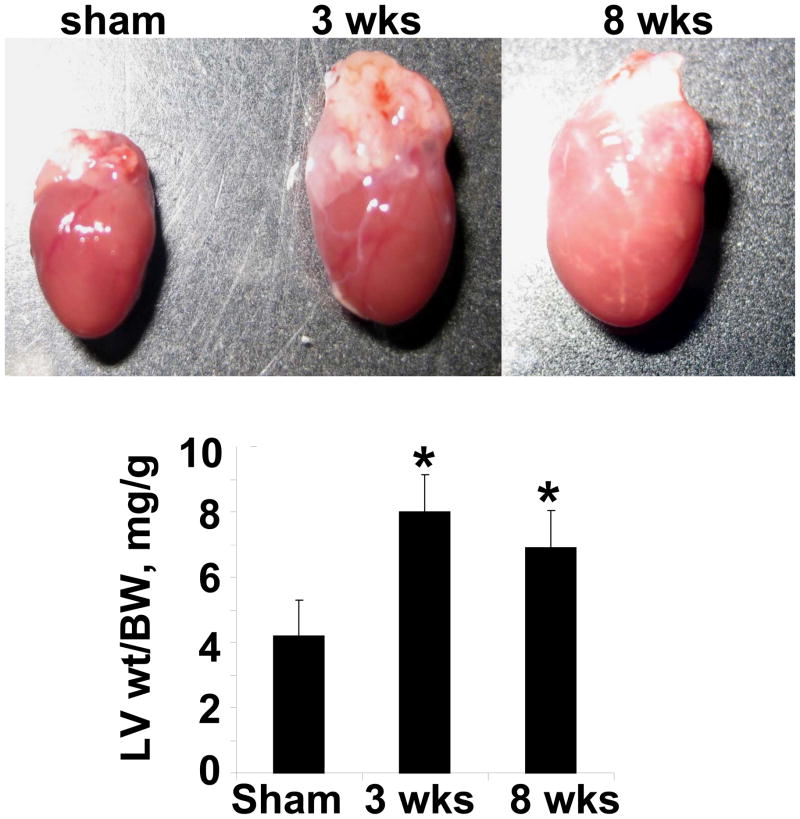
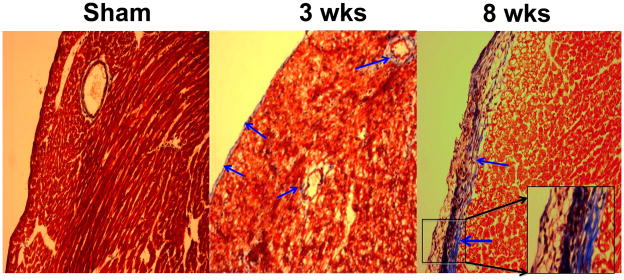
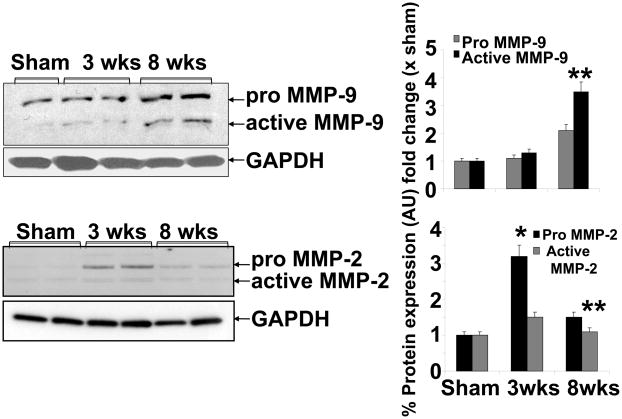
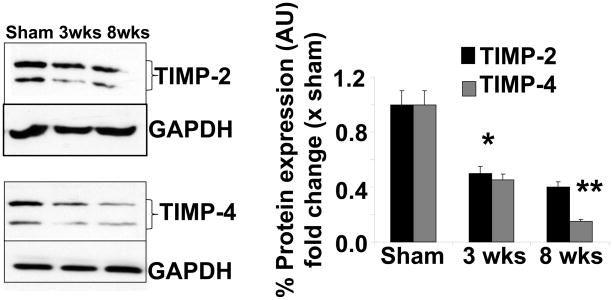
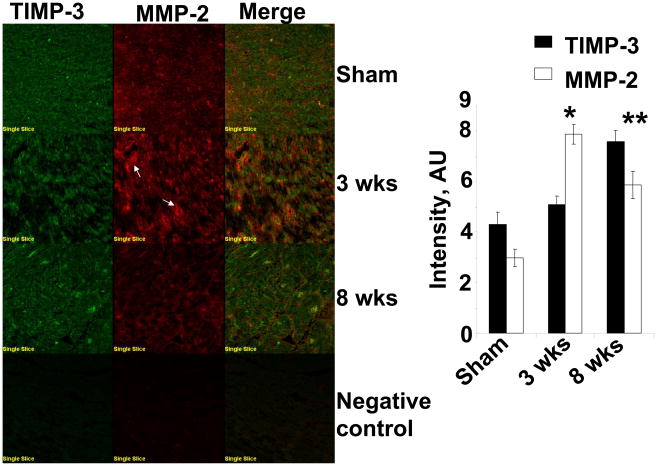
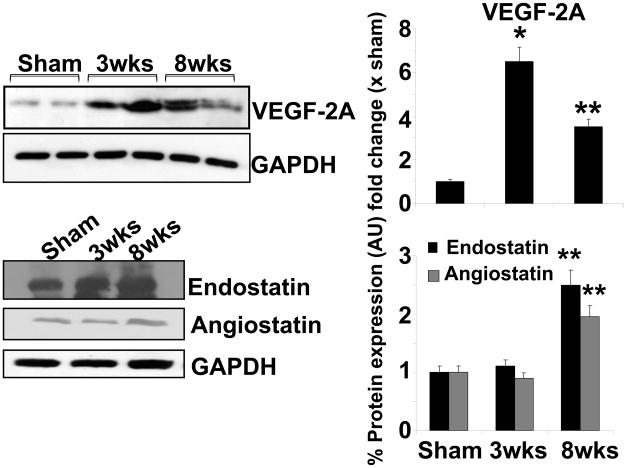
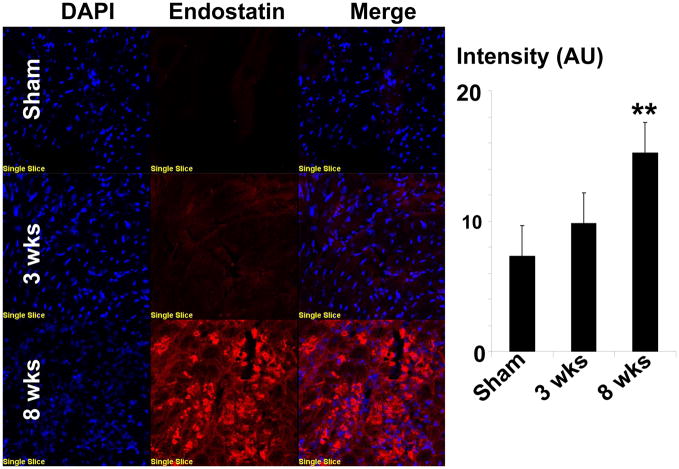
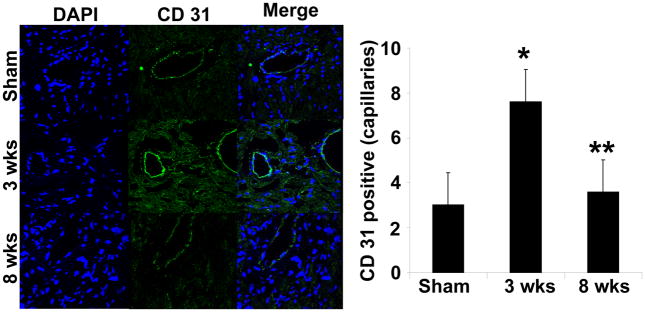
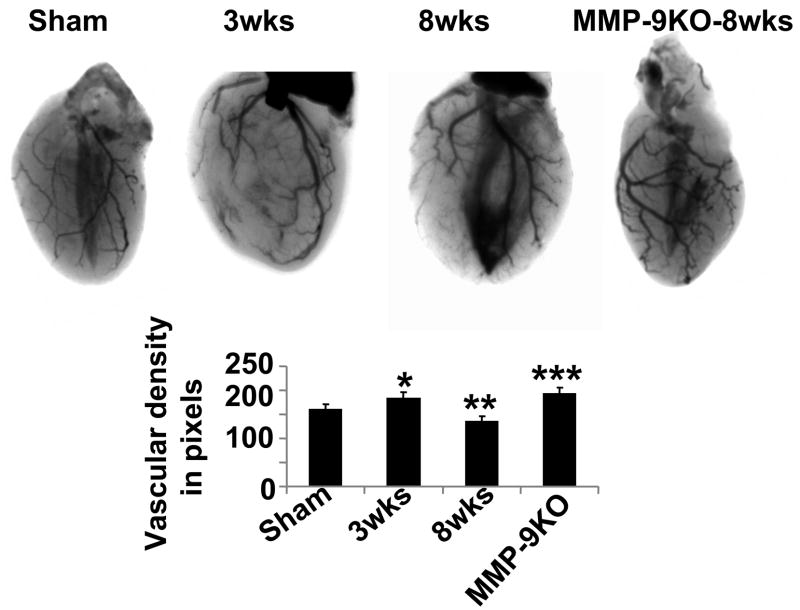
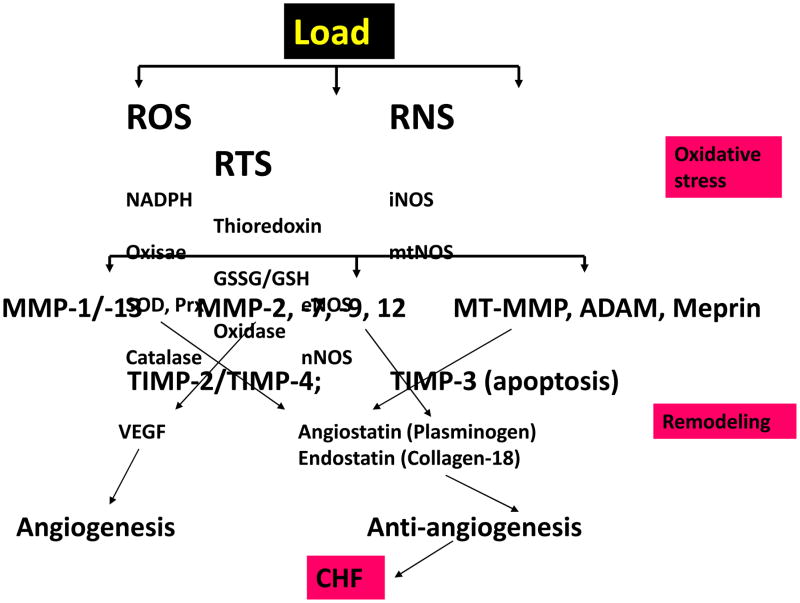
Although matrix metalloproteinase (MMPs) and tissue inhibitor of metalloproteinase (TIMPs) play a vital role in tumour angiogenesis and TIMP-3 caused apoptosis, their role in cardiac angiogenesis is unknown. Interestingly, a disruption of co-ordinated cardiac hypertrophy and angiogenesis contributed to the transition to heart failure, however, the proteolytic and anti-angiogenic mechanisms of transition from compensatory hypertrophy to decompensatory heart failure were unclear. We hypothesized that after an aortic stenosis MMP-2 released angiogenic factors during compensatory hypertrophy and MMP-9/TIMP-3 released anti-angiogenic factors causing decompensatory heart failure. To verify this hypothesis, wild type (WT) mice were studied 3 and 8 weeks after aortic stenosis, created by banding the ascending aorta in WT and MMP-9-/- (MMP-9KO) mice. Cardiac function (echo, PV loops) was decreased at 8 weeks after stenosis. The levels of MMP-2 (western blot) increased at 3 weeks and returned to control level at 8 weeks, MMP-9 increased only at 8 weeks. TIMP-2 and -4 decreased at 3 and even more at 8 weeks. The angiogenic VEGF increased at 3 weeks and decreased at 8 weeks, the anti-angiogenic endostatin and angiostatin increased only at 8 weeks. CD-31 positive endothelial cells were more intensely labelled at 3 weeks than in sham operated or in 8 weeks banded mice. Vascularization, as estimated by x-ray angiography, was increased at 3 weeks and decreased at 8 weeks post-banding. Although the vast majority of studies were performed on control WT mice only, interestingly, MMP9-KO mice seemed to have increased vascular density 8 weeks after banding. These results suggested that there was increase in MMP-2, decrease in TIMP-2 and -4, increase in angiogenic factors and vascularization in compensatory hearts. However, in decompensatory hearts there was increase in MMP-9, TIMP-3, endostatin, angiostatin and vascular rarefaction.
Figures
Similar articles
-
TIMP-2 mutant decreases MMP-2 activity and augments pressure overload induced LV dysfunction and heart failure.Arch Physiol Biochem. 2013 May;119(2):65-74. doi: 10.3109/13813455.2012.755548. Epub 2013 Feb 11. Arch Physiol Biochem. 2013. PMID: 23398532 Free PMC article.
-
Hydrogen sulfide mitigates transition from compensatory hypertrophy to heart failure.J Appl Physiol (1985). 2011 Apr;110(4):1093-100. doi: 10.1152/japplphysiol.01064.2010. Epub 2011 Jan 13. J Appl Physiol (1985). 2011. PMID: 21233344 Free PMC article.
-
Combination of tumor necrosis factor-alpha ablation and matrix metalloproteinase inhibition prevents heart failure after pressure overload in tissue inhibitor of metalloproteinase-3 knock-out mice.Circ Res. 2005 Aug 19;97(4):380-90. doi: 10.1161/01.RES.0000178789.16929.cf. Epub 2005 Jul 21. Circ Res. 2005. PMID: 16037568
-
Differential expression of MMP-2, MMP-9 and TIMP proteins in thoracic aortic aneurysm - comparison with and without bicuspid aortic valve: a meta-analysis.Vasa. 2014 Nov;43(6):433-42. doi: 10.1024/0301-1526/a000390. Vasa. 2014. PMID: 25339161 Review.
-
The tumor microenvironment: regulation by MMP-independent effects of tissue inhibitor of metalloproteinases-2.Cancer Metastasis Rev. 2008 Mar;27(1):57-66. doi: 10.1007/s10555-007-9105-8. Cancer Metastasis Rev. 2008. PMID: 18058195 Free PMC article. Review.
Cited by
-
Endostatin inhibits bradykinin-induced cardiac contraction.J Vet Med Sci. 2015 Nov;77(11):1391-5. doi: 10.1292/jvms.15-0200. Epub 2015 Jun 5. J Vet Med Sci. 2015. PMID: 26050753 Free PMC article.
-
Cardiac matrix: a clue for future therapy.Biochim Biophys Acta. 2013 Dec;1832(12):2271-6. doi: 10.1016/j.bbadis.2013.09.004. Epub 2013 Sep 17. Biochim Biophys Acta. 2013. PMID: 24055000 Free PMC article. Review.
-
Differential mRNA Expression and Circular RNA-Based Competitive Endogenous RNA Networks in the Three Stages of Heart Failure in Transverse Aortic Constriction Mice.Front Physiol. 2022 Mar 7;13:777284. doi: 10.3389/fphys.2022.777284. eCollection 2022. Front Physiol. 2022. PMID: 35330931 Free PMC article.
-
Mitochondrial fusion and fission proteins as novel therapeutic targets for treating cardiovascular disease.Eur J Pharmacol. 2015 Sep 15;763(Pt A):104-14. doi: 10.1016/j.ejphar.2015.04.056. Epub 2015 May 16. Eur J Pharmacol. 2015. PMID: 25987420 Free PMC article. Review.
-
Regulation of collagen deposition in the trout heart during thermal acclimation.Curr Res Physiol. 2022 Feb 11;5:99-108. doi: 10.1016/j.crphys.2022.02.004. eCollection 2022. Curr Res Physiol. 2022. PMID: 35243359 Free PMC article.
References
-
- Allard MF, Flint JD, English JC, Henning SL, Salamanca MC, Kamimura CT, English DR. Calcium overload during reperfusion is accelerated in isolated hypertrophied rat hearts. J Mol Cell Cardiol. 1994;26:1551–1563. - PubMed
-
- Boluyt MO, O’Neill L, Meredith AL, Bing OH, Brooks WW, Conrad CH, Crow MT, Lakatta EG. Alterations in cardiac gene expression during the transition from stable hypertrophy to heart failure. Marked upregulation of genes encoding extracellular matrix components. Circ Res. 1994;75(1):23–32. - PubMed
-
- Camp TM, Tyagi SC, Senior RM, Hayden MR, Tyagi SC. Gelatinase B (MMP-9) an apoptotic factor in diabetic transgenic mice. Diabetologia. 2003;46(10):1438–1445. - PubMed
-
- Dhanabal M, Ramchandran R, Waterman MJ, Lu H, Knebelmann B, Segal M, Sukhatme VP. Endostatin induces endothelial cell apoptosis. J Biol Chem. 1999;274:11721–11726. - PubMed
Publication types
MeSH terms
Substances
Grants and funding
LinkOut - more resources
Full Text Sources
Research Materials
Miscellaneous