

doi: 10.1186/gb-2010-11-3-r32.
Epub 2010 Mar 11.
Characterizing regulatory path motifs in integrated networks using perturbational data
Affiliations
- PMID: 20230615
- PMCID: PMC2864572
- DOI: 10.1186/gb-2010-11-3-r32
Item in Clipboard
Characterizing regulatory path motifs in integrated networks using perturbational data
Genome Biol.
2010.
Abstract
We introduce Pathicular http://bioinformatics.psb.ugent.be/software/details/Pathicular, a Cytoscape plugin for studying the cellular response to perturbations of transcription factors by integrating perturbational expression data with transcriptional, protein-protein and phosphorylation networks. Pathicular searches for 'regulatory path motifs', short paths in the integrated physical networks which occur significantly more often than expected between transcription factors and their targets in the perturbational data. A case study in Saccharomyces cerevisiae identifies eight regulatory path motifs and demonstrates their biological significance.
Figures
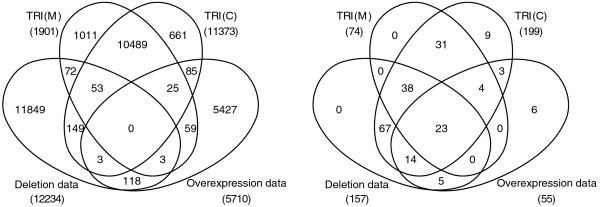
Overlap between transcription factor-target pairs. The overlap between four data sets of transcription factor-target pairs (a) and transcription factors under study (b) showing that there is not a single common transcription factor-target pair inferred by all methods despite 23 common transcription factors.
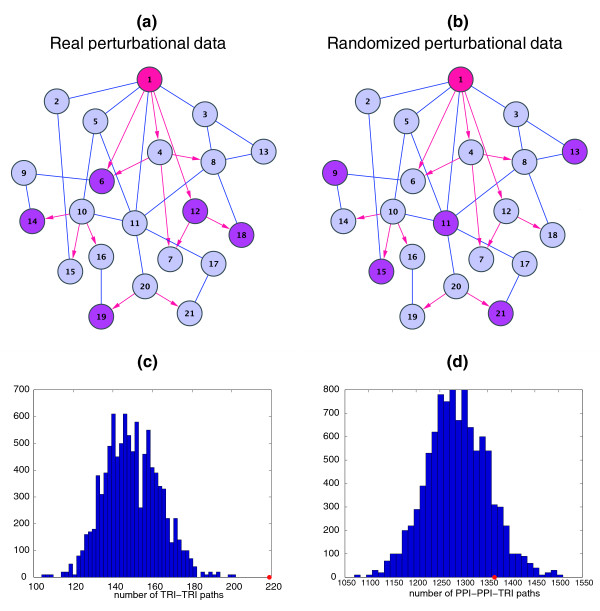
Randomization procedure. (a), (b) shows a hypothetical example of an integrated network of transcriptional links (red), with nodes 1, 4, 10, 12 and 20 being transcription factors, and protein-protein interactions (blue) with one hub protein (node 11). Observed perturbed genes (magenta) when a transcription factor is deleted or overexpressed (node 1, red) is shown on the left (a) and a randomized perturbed data set with the same integrated network is shown on the right (b). With respect to the background distribution of 10,000 such random samples from real data, the TRI-TRI regulatory path (c) is overrepresented as the observed value (red dot) lies at far right tail of the distribution (green curve), while the PPI-PPI-TRI regulatory path (d) is not overrepresented as the observed value lies well within the random distribution.
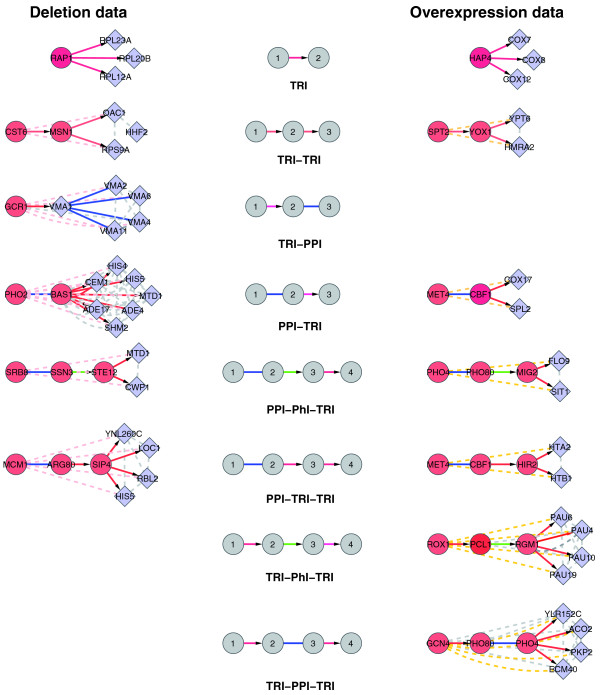
Regulatory path motifs. List of eight enriched regulatory path motifs in deletion and over-expression data, showing five paths common to both. Path motifs are at the center while at the sides an example in each data set is shown. TRI are in red, PPI in blue and PhI in green. The dashed gray edges represent coexpression links while pink and orange edges represent deletion and overexpression links respectively.
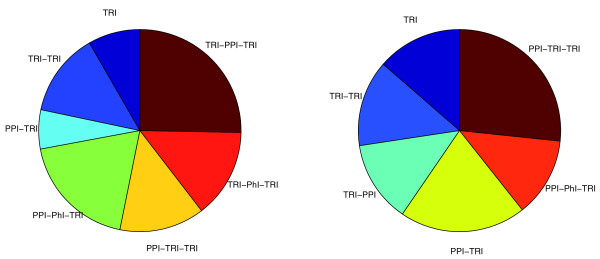
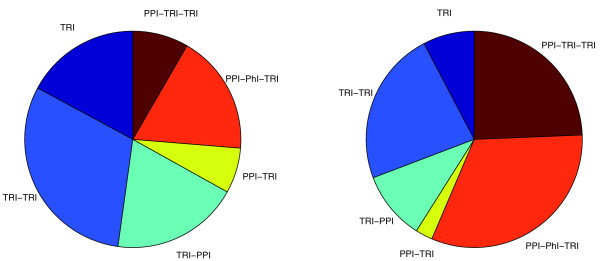
Relative abundance of path motifs. The relative fraction of each regulatory path motif in overexpression data (left) and deletion data (right). These show that the direct targets form a small fraction of the total number of targets.
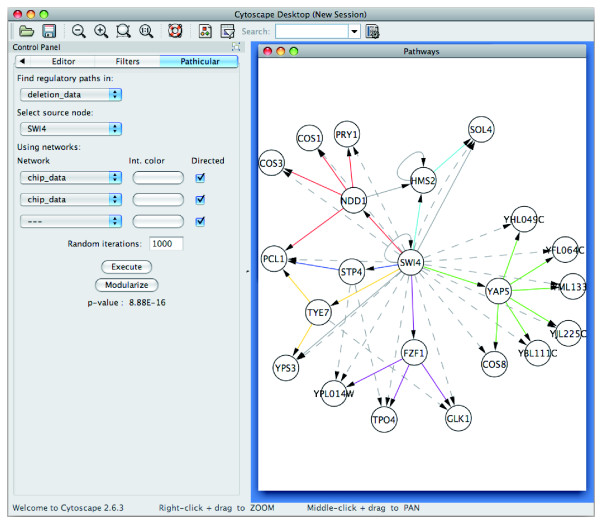
A screenshot of Pathicular. Screenshot of Pathicular running in Cytoscape with an example of a TRI-TRI path motif overrepresented in deletion data for the transcription factor SWI4. Solid edges represent TRI edges, colored by path module membership. Dashed edges represent edges in the deletion data. Solid gray edges are additional TRI edges which do not belong to a TRI-TRI motif in this subnetwork.
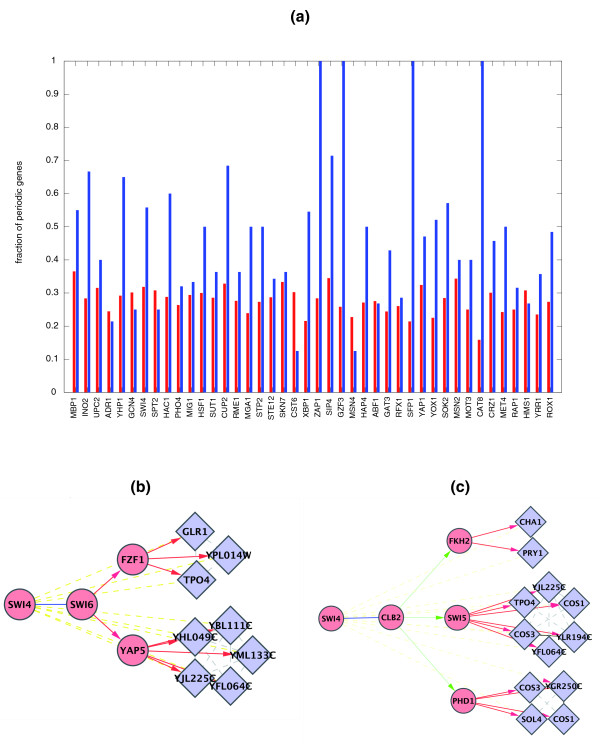
Periodic path modules. (a) The fraction of periodic targets among all perturbed genes (red) of a given transcription factor, and the fraction found in enriched motifs (blue) in overexpression data, showing all transcription factors with at least one periodically expressed target. Two path modules overrepresented in periodic genes for the PPI-TRI-TRI path in overexpression data (b) and the PPI-PhI-TRI path in deletion data (c). TRI are in red, PPI in blue and PhI in green. The dotted gray lines represent coexpression links while yellow lines represent deletion or overexpression links.
Relative abundance of path motifs in conditional networks. The relative fraction of each regulatory path motif in deletion data under DNA-damage stress (left) and cell cycle (right). These show differences in network structure under different conditions.
Similar articles
-
CyClus3D: a Cytoscape plugin for clustering network motifs in integrated networks.Bioinformatics. 2011 Jun 1;27(11):1587-8. doi: 10.1093/bioinformatics/btr182. Epub 2011 Apr 8. Bioinformatics. 2011. PMID: 21478195
-
Switched Latent Force Models for Reverse-Engineering Transcriptional Regulation in Gene Expression Data.IEEE/ACM Trans Comput Biol Bioinform. 2019 Jan-Feb;16(1):322-335. doi: 10.1109/TCBB.2017.2764908. Epub 2017 Oct 23. IEEE/ACM Trans Comput Biol Bioinform. 2019. PMID: 29990003
-
Integrated module and gene-specific regulatory inference implicates upstream signaling networks.PLoS Comput Biol. 2013;9(10):e1003252. doi: 10.1371/journal.pcbi.1003252. Epub 2013 Oct 17. PLoS Comput Biol. 2013. PMID: 24146602 Free PMC article.
-
The executable pathway to biological networks.Brief Funct Genomics. 2010 Jan;9(1):79-92. doi: 10.1093/bfgp/elp054. Brief Funct Genomics. 2010. PMID: 20118126 Free PMC article. Review.
-
Advances in the integration of transcriptional regulatory information into genome-scale metabolic models.Biosystems. 2016 Sep;147:1-10. doi: 10.1016/j.biosystems.2016.06.001. Epub 2016 Jun 7. Biosystems. 2016. PMID: 27287878 Review.
Cited by
-
Genome wide gene expression regulation by HIP1 Protein Interactor, HIPPI: prediction and validation.BMC Genomics. 2011 Sep 26;12:463. doi: 10.1186/1471-2164-12-463. BMC Genomics. 2011. PMID: 21943362 Free PMC article.
-
Advantages and limitations of current network inference methods.Nat Rev Microbiol. 2010 Oct;8(10):717-29. doi: 10.1038/nrmicro2419. Epub 2010 Aug 31. Nat Rev Microbiol. 2010. PMID: 20805835 Review.
-
YTRP: a repository for yeast transcriptional regulatory pathways.Database (Oxford). 2014 Mar 7;2014:bau014. doi: 10.1093/database/bau014. Print 2014. Database (Oxford). 2014. PMID: 24608172 Free PMC article.
-
Sexual Dimorphism and Aging in the Human Hyppocampus: Identification, Validation, and Impact of Differentially Expressed Genes by Factorial Microarray and Network Analysis.Front Aging Neurosci. 2016 Oct 5;8:229. doi: 10.3389/fnagi.2016.00229. eCollection 2016. Front Aging Neurosci. 2016. PMID: 27761111 Free PMC article.
-
COX2-ATP Synthase Regulates Spine Follicle Size in Hedgehogs.Int J Biol Sci. 2023 Sep 4;19(15):4763-4777. doi: 10.7150/ijbs.83387. eCollection 2023. Int J Biol Sci. 2023. PMID: 37781513 Free PMC article.
References
-
- Ideker T, Ozier O, Schwikowski B, Siegel AF. Discovering regulatory and signalling circuits in molecular interaction networks. Bioinformatics. 2002;18(Suppl 1):S233–240. - PubMed
Publication types
MeSH terms
Substances
LinkOut - more resources
Full Text Sources
Molecular Biology Databases
