

The use of a geographic information system to identify a dairy goat farm as the most likely source of an urban Q-fever outbreak
- PMID: 20230650
- PMCID: PMC2848044
- DOI: 10.1186/1471-2334-10-69
The use of a geographic information system to identify a dairy goat farm as the most likely source of an urban Q-fever outbreak
Abstract
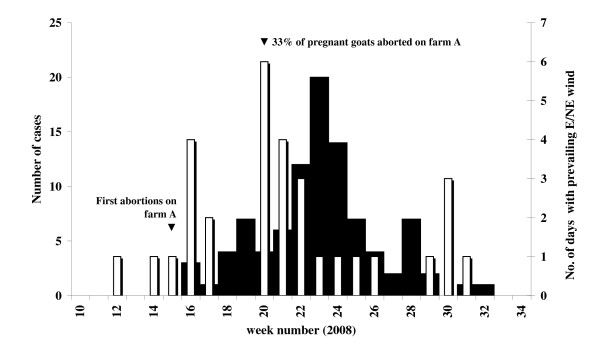
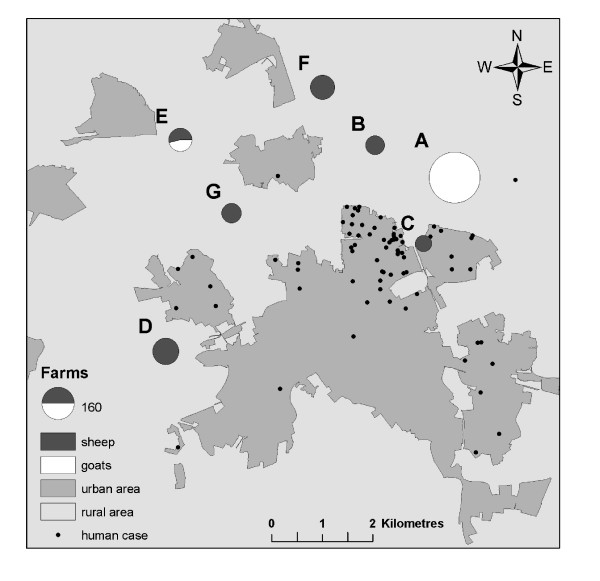
Background: A Q-fever outbreak occurred in an urban area in the south of the Netherlands in May 2008. The distribution and timing of cases suggested a common source. We studied the spatial relationship between the residence locations of human cases and nearby small ruminant farms, of which one dairy goat farm had experienced abortions due to Q-fever since mid April 2008. A generic geographic information system (GIS) was used to develop a method for source detection in the still evolving major epidemic of Q-fever in the Netherlands.
Methods: All notified Q-fever cases in the area were interviewed. Postal codes of cases and of small ruminant farms (size >40 animals) located within 5 kilometres of the cluster area were geo-referenced as point locations in a GIS-model. For each farm, attack rates and relative risks were calculated for 5 concentric zones adding 1 kilometre at a time, using the 5-10 kilometres zone as reference. These data were linked to the results of veterinary investigations.
Results: Persons living within 2 kilometres of an affected dairy goat farm (>400 animals) had a much higher risk for Q-fever than those living more than 5 kilometres away (Relative risk 31.1 [95% CI 16.4-59.1]).
Conclusions: The study supported the hypothesis that a single dairy goat farm was the source of the human outbreak. GIS-based attack rate analysis is a promising tool for source detection in outbreaks of human Q-fever.
Figures
References
-
- Schimmer B, Morroy G, Dijkstra F, Schneeberger PM, Weers-Pothoff G, Timen A, Wijkmans C, Hoek W van der. Large ongoing Q fever outbreak in the south of The Netherlands, 2008. Euro Surveill. 2008;13 pii: 18939. - PubMed
-
- Schimmer B, Dijkstra F, Vellema P, Schneeberger PM, Hackert V, ter Schegget R, Wijkmans C, van Duynhoven Y, Hoek W van der. Sustained intensive transmission of Q fever in the south of the Netherlands, 2009. Euro Surveill. 2009;14 pii: 19210. - PubMed
-
- Brom R Van den, Vellema P. Q fever outbreaks in small ruminants and people in the Netherlands. Small Ruminant Res. 2009;86:74–79. doi: 10.1016/j.smallrumres.2009.09.022. - DOI
MeSH terms
LinkOut - more resources
Full Text Sources
Medical
Miscellaneous
