Drinking, driving, and crashing: a traffic-flow model of alcohol-related motor vehicle accidents
- PMID: 20230721
- PMCID: PMC2841734
- DOI: 10.15288/jsad.2010.71.237
Drinking, driving, and crashing: a traffic-flow model of alcohol-related motor vehicle accidents
Abstract
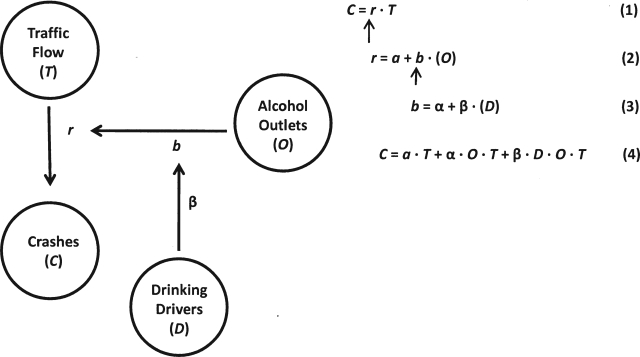
Objective: This study examined the influence of on-premise alcohol-outlet densities and of drinking-driver densities on rates of alcohol-related motor vehicle crashes. A traffic-flow model is developed to represent geographic relationships between residential locations of drinking drivers, alcohol outlets, and alcohol-related motor vehicle crashes.
Method: Cross-sectional and time-series cross-sectional spatial analyses were performed using data collected from 144 geographic units over 4 years. Data were obtained from archival and survey sources in six communities. Archival data were obtained within community areas and measured activities of either the resident population or persons visiting these communities. These data included local and highway traffic flow, locations of alcohol outlets, population density, network density of the local roadway system, and single-vehicle nighttime (SVN) crashes. Telephone-survey data obtained from residents of the communities were used to estimate the size of the resident drinking and driving population.
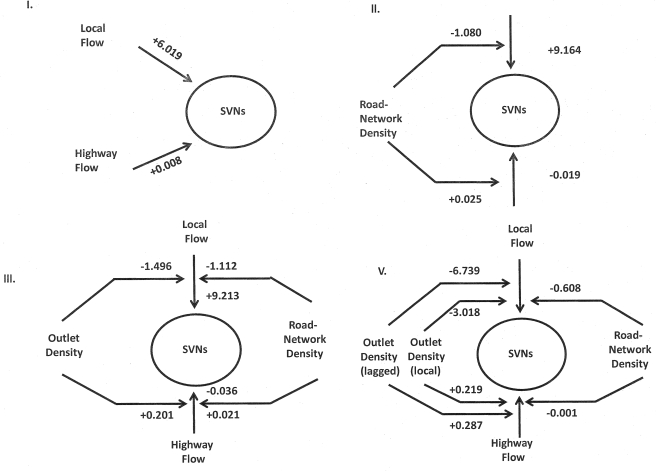
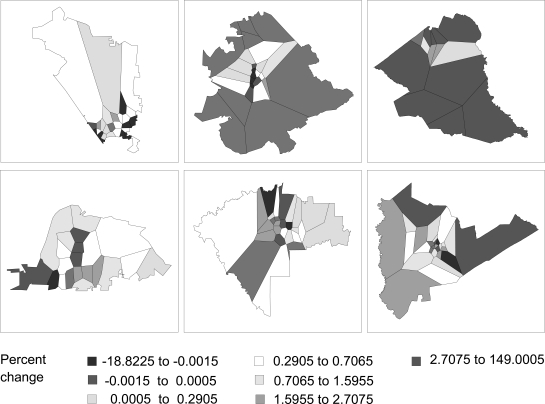
Results: Cross-sectional analyses showed that effects relating on-premise densities to alcohol-related crashes were moderated by highway trafficflow. Depending on levels of highway traffic flow, 10% greater densities were related to 0% to 150% greater rates of SVN crashes. Time-series cross-sectional analyses showed that changes in the population pool of drinking drivers and on-premise densities interacted to increase SVN crash rates.
Conclusions: A simple traffic-flow model can assess the effects of on-premise alcohol-outlet densities and of drinking-driver densities as they vary across communities to produce alcohol-related crashes. Analyses based on these models can usefully guide policy decisions on the sitting of on-premise alcohol outlets.
Figures
Similar articles
-
The impact of outlet densities on alcohol-related crashes: a spatial panel approach.Accid Anal Prev. 2007 Sep;39(5):894-901. doi: 10.1016/j.aap.2006.12.011. Epub 2007 Feb 2. Accid Anal Prev. 2007. PMID: 17275773
-
Space-Time Analyses of Alcohol Outlets and Related Motor Vehicle Crashes: Associations at City and Census Block-Group Levels.Alcohol Clin Exp Res. 2018 Jun;42(6):1113-1121. doi: 10.1111/acer.13758. Epub 2018 May 20. Alcohol Clin Exp Res. 2018. PMID: 29672873 Free PMC article.
-
Spatial panel analyses of alcohol outlets and motor vehicle crashes in California: 1999-2008.Accid Anal Prev. 2013 Jun;55:135-43. doi: 10.1016/j.aap.2013.03.001. Epub 2013 Mar 13. Accid Anal Prev. 2013. PMID: 23537623 Free PMC article.
-
Policy alternatives for alcohol-impaired driving.Health Educ Q. 1989 Fall;16(3):413-27. doi: 10.1177/109019818901600309. Health Educ Q. 1989. PMID: 2676914 Review.
-
Emergency intervention to break the cycle of drunken driving and recurrent injury.Ann Emerg Med. 1995 Aug;26(2):177-9. doi: 10.1016/s0196-0644(95)70148-6. Ann Emerg Med. 1995. PMID: 7618780 Review.
Cited by
-
Stressful life experiences, alcohol consumption, and alcohol use disorders: the epidemiologic evidence for four main types of stressors.Psychopharmacology (Berl). 2011 Nov;218(1):1-17. doi: 10.1007/s00213-011-2236-1. Epub 2011 Mar 5. Psychopharmacology (Berl). 2011. PMID: 21373787 Free PMC article. Review.
-
The Moderating Effect of Substance Abuse Service Accessibility on the Relationship between Child Maltreatment and Neighborhood Alcohol Availability.Child Youth Serv Rev. 2013 Dec;35(12):1933-1940. doi: 10.1016/j.childyouth.2013.09.019. Child Youth Serv Rev. 2013. PMID: 24436505 Free PMC article.
-
Reaching the hard-to-reach: a probability sampling method for assessing prevalence of driving under the influence after drinking in alcohol outlets.PLoS One. 2012;7(4):e34104. doi: 10.1371/journal.pone.0034104. Epub 2012 Apr 13. PLoS One. 2012. PMID: 22514620 Free PMC article.
-
Spatial relationships between alcohol-related road crashes and retail alcohol availability.Drug Alcohol Depend. 2016 May 1;162:241-4. doi: 10.1016/j.drugalcdep.2016.02.033. Epub 2016 Mar 2. Drug Alcohol Depend. 2016. PMID: 26968094 Free PMC article.
-
The Association between Regional Environmental Factors and Road Trauma Rates: A Geospatial Analysis of 10 Years of Road Traffic Crashes in British Columbia, Canada.PLoS One. 2016 Apr 21;11(4):e0153742. doi: 10.1371/journal.pone.0153742. eCollection 2016. PLoS One. 2016. PMID: 27099930 Free PMC article.
References
-
- Chou Y-H. Map resolution and spatial autocorrelation. Geographical Analysis. 1991;23:228–246.
-
- Cliff AD, Ord JK. Spatial processes: Models and applications. London, England: Pion Limited; 1981.
-
- Colon I, Cutter HS. The relationship between beer consumption and state alcohol and motor vehicle policies to fatal accidents. Journal of Safety Research. 1983;14(2):83–89.
-
- Escobedo LG, Ortiz M. The relationship between liquor outlet density and injury and violence in New Mexico. Accident Analysis & Prevention. 2002;34:689–694. - PubMed
-
- Greene WH. Econometric analysis. 2nd ed. New York: Macmillan; 1993.
Publication types
MeSH terms
Grants and funding
LinkOut - more resources
Full Text Sources
Medical