

An endocrine-disrupting chemical, fenvalerate, induces cell cycle progression and collagen type I expression in human uterine leiomyoma and myometrial cells
- PMID: 20230880
- PMCID: PMC2937012
- DOI: 10.1016/j.toxlet.2010.03.004
An endocrine-disrupting chemical, fenvalerate, induces cell cycle progression and collagen type I expression in human uterine leiomyoma and myometrial cells
Abstract
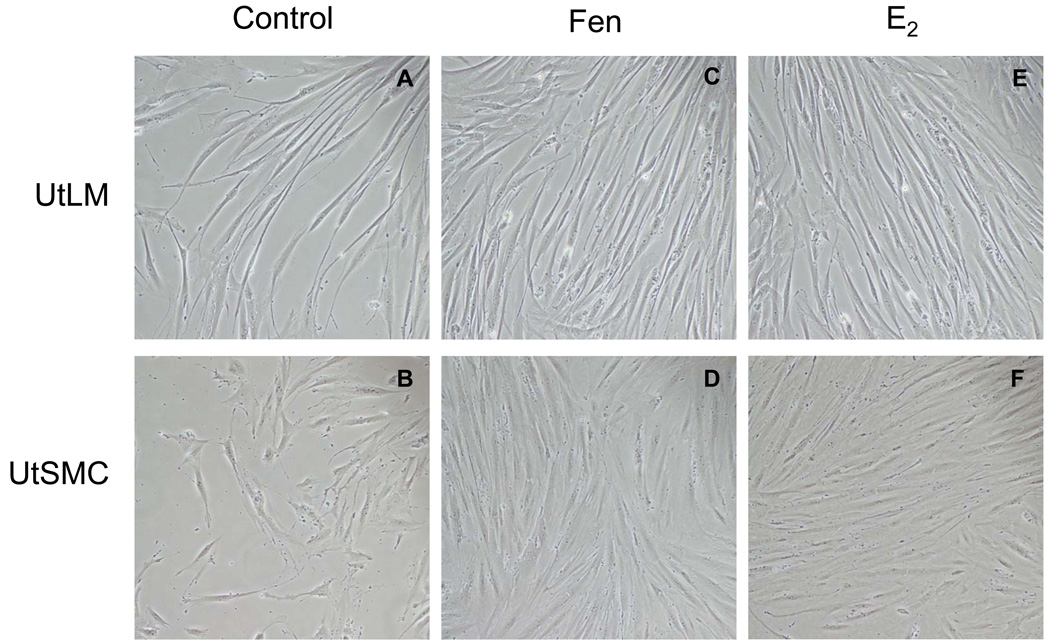
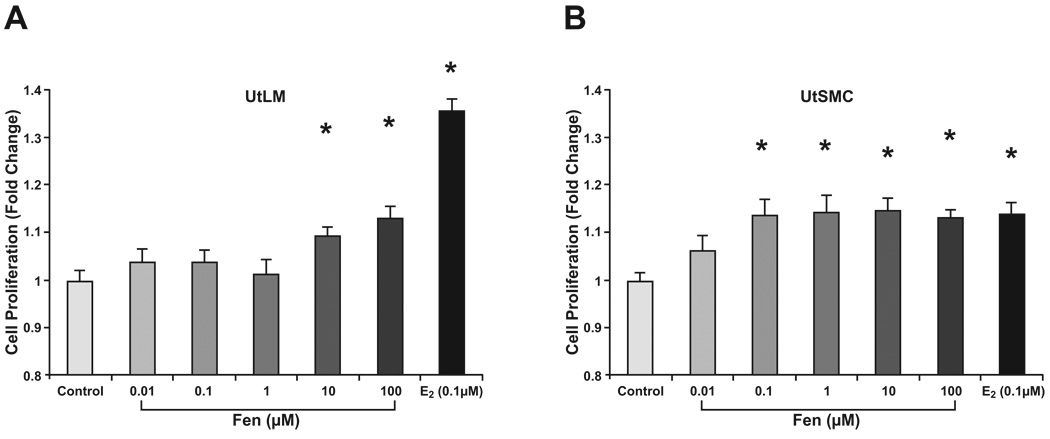
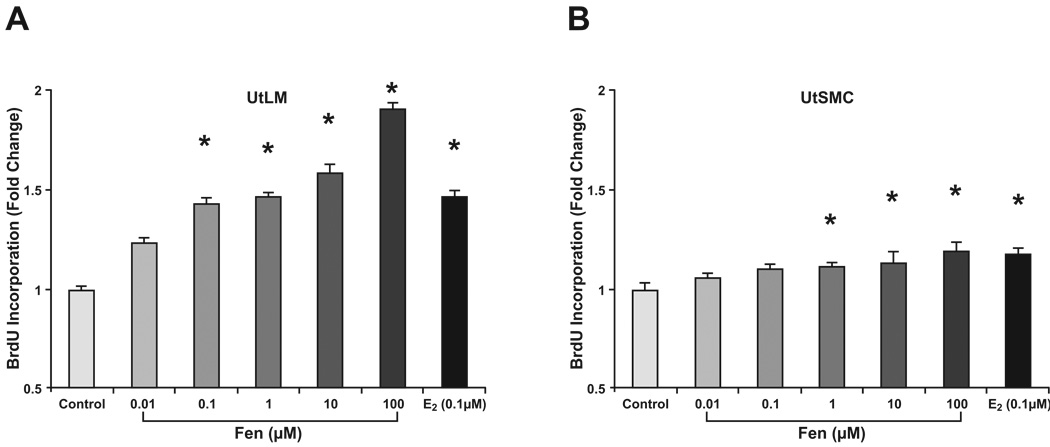
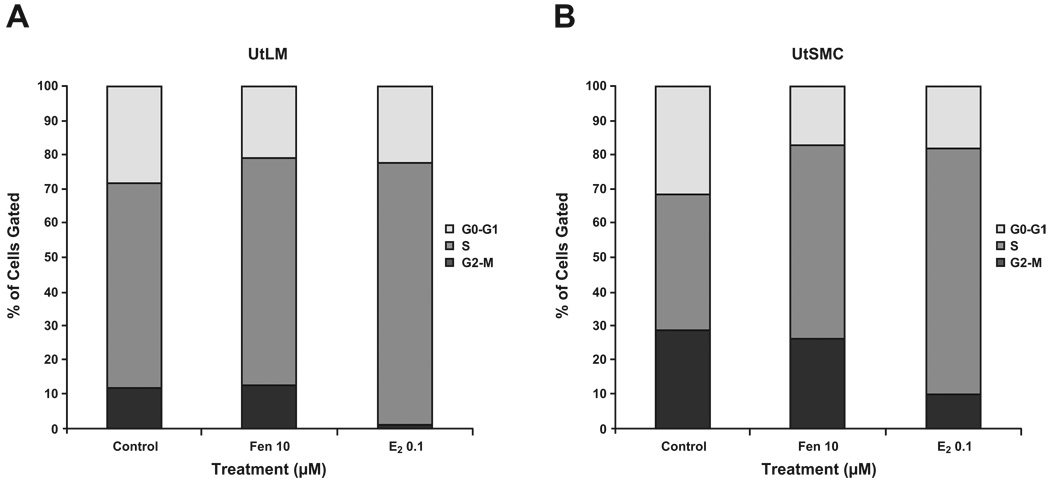
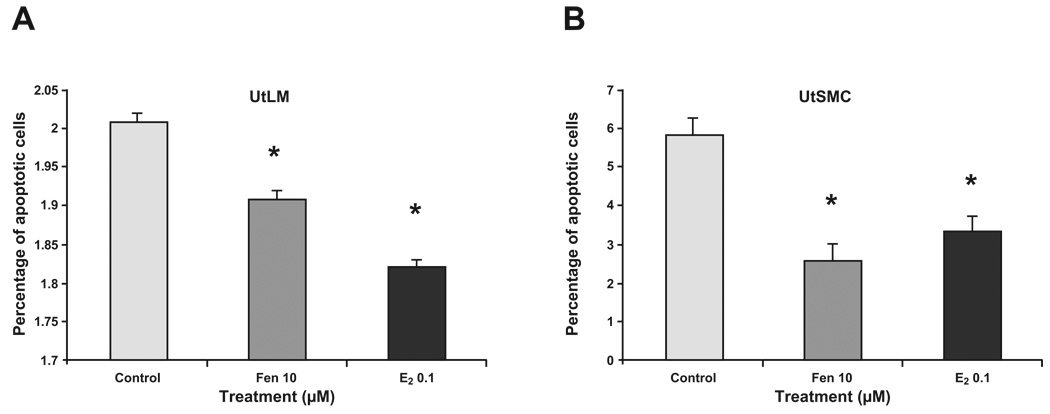
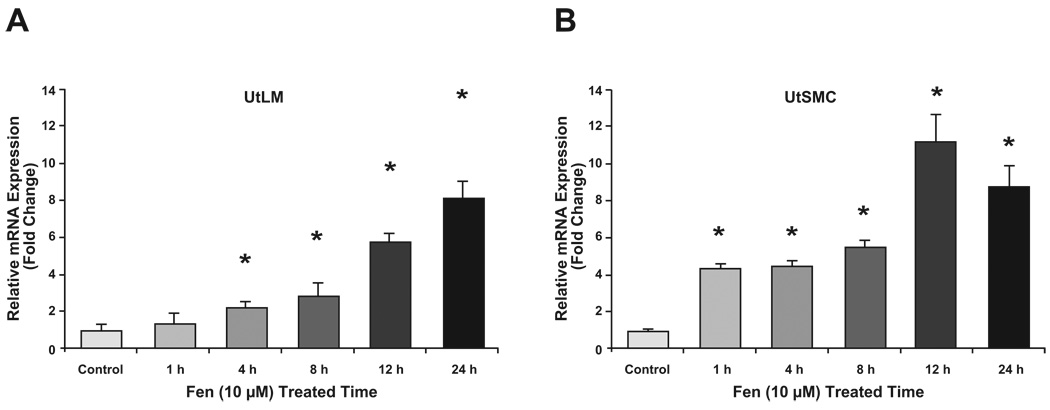
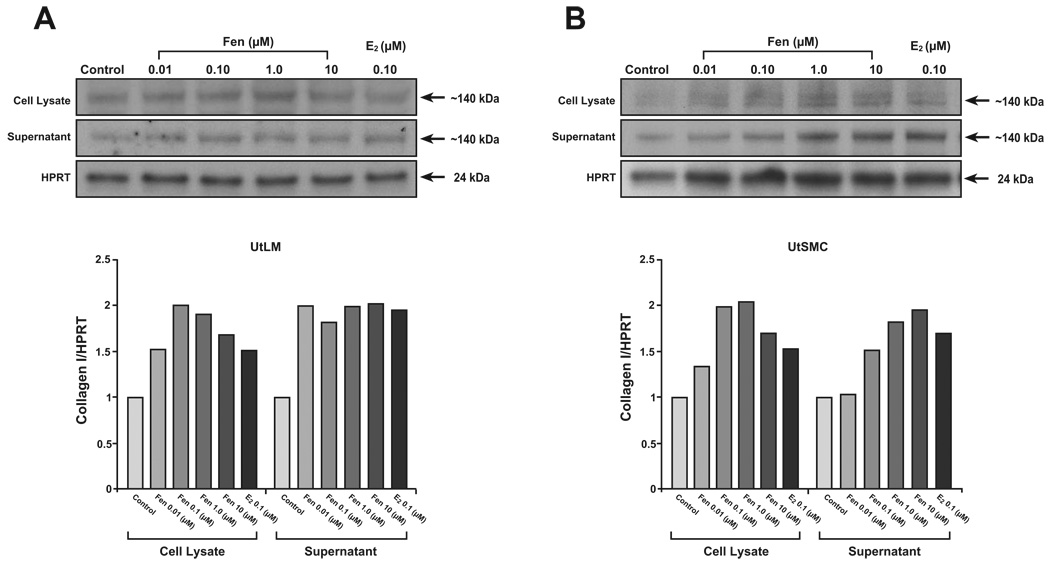
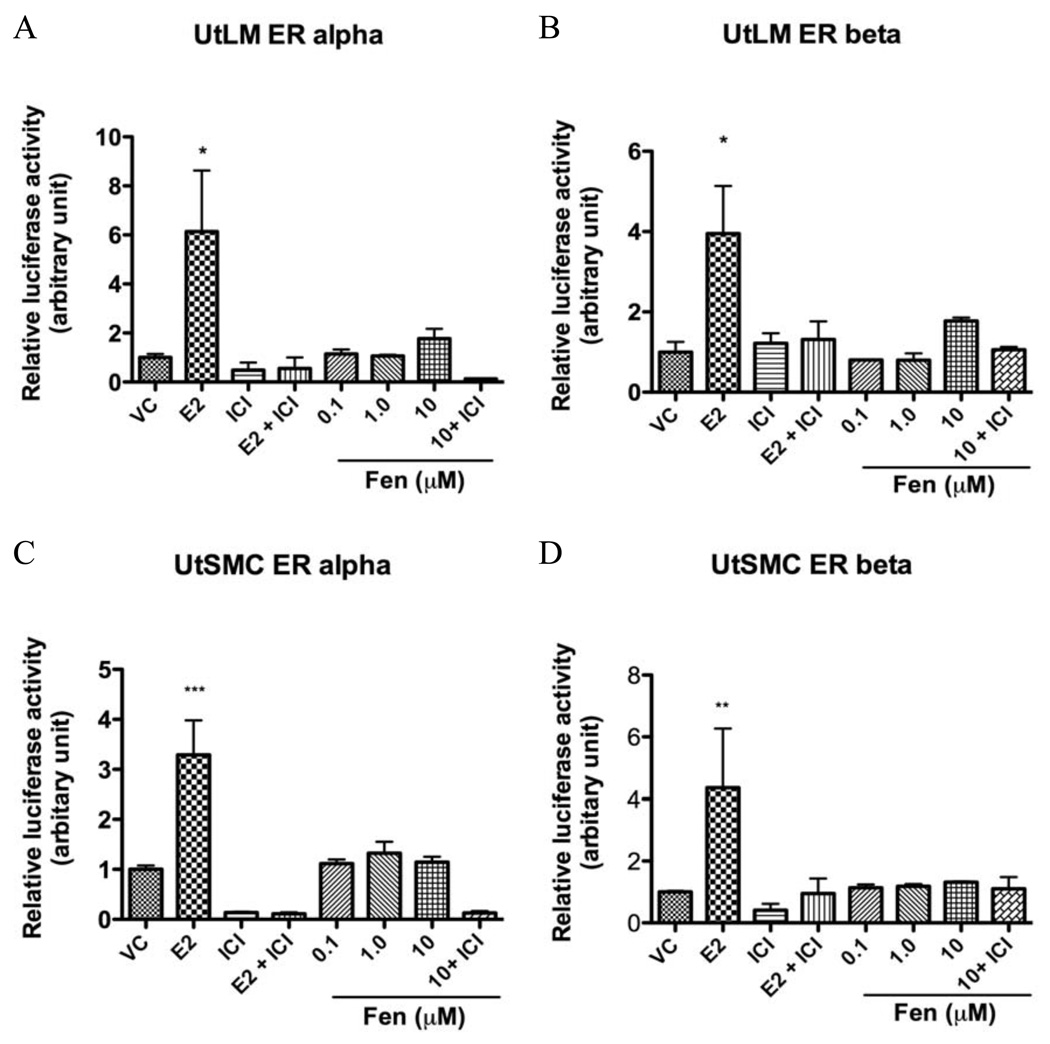
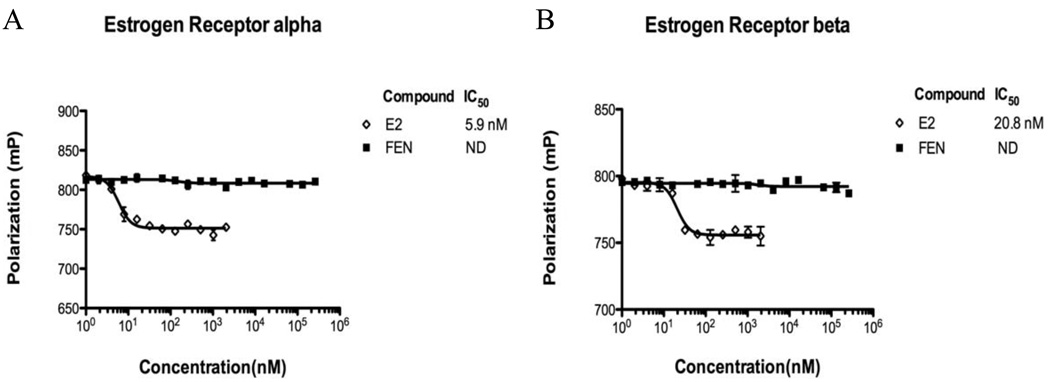
Fenvalerate (Fen), widely used for its high insecticidal potency and low mammalian toxicity, is classified as an endocrine-disrupting chemical. Recently, Fen has received great attention for its adverse effects on human reproductive health. In this study, we found that Fen (10 microM) had a stimulatory effect on the growth of both cell lines at 24 h compared with controls by MTS (p < 0.01) and BrdU (p < 0.01) assays in hormonally responsive uterine leiomyoma (UtLM) cells and normal uterine smooth muscle cells (UtSMC). Flow cytometry results showed that Fen enhanced the escape of cells from the G(0)-G(1) checkpoint and promoted progression of both cell types into the S phase. An Annexin V assay showed that Fen had an anti-apoptotic effect on both cell types. By Real-time PCR, we found that collagen I mRNA expression increased (p < 0.05) in Fen-treated cells compared to controls, although it was greater in UtLM tumor cells. Accordingly, Fen increased (p < 0.05) collagen I protein levels in both cell lysate and supernatant when compared to controls. To further test the mechanism of Fen's effects, transactivation and competitive binding assays were done. The results showed Fen did not significantly stimulate luciferase activity at concentrations of 0.1 microM, 1.0 microM or 10.0 microM in either of the cell types. Competitive binding assays revealed that the affinity of Fen binding to estrogen receptors (ERs) was non-detectable compared to E(2). Our data show that Fen can stimulate the growth of both UtLM cells and UtSMC, which involves a combination of enhanced cell cycle progression and inhibition of apoptosis. Also this compound can increase collagen I expression, at both mRNA and protein levels. Interestingly, the ER is less likely involved in either the hyperplasia or extracellular matrix (ECM) overproduction induced by Fen. Our results indicate that Fen exposure could be considered a novel risk factor for uterine fibroids through molecular mechanisms that do not directly involve the ERs.
Published by Elsevier Ireland Ltd.
Conflict of interest statement
None declared.
Figures
Similar articles
-
An essential role of p27 downregulation in fenvalerate-induced cell growth in human uterine leiomyoma and smooth muscle cells.Am J Physiol Endocrinol Metab. 2012 Oct 15;303(8):E1025-35. doi: 10.1152/ajpendo.00107.2012. Epub 2012 Jul 31. Am J Physiol Endocrinol Metab. 2012. PMID: 22850687 Free PMC article.
-
In vitro effects of phthalate esters in human myometrial and leiomyoma cells and increased urinary level of phthalate metabolite in women with uterine leiomyoma.Fertil Steril. 2017 Apr;107(4):1061-1069.e1. doi: 10.1016/j.fertnstert.2017.01.015. Epub 2017 Mar 11. Fertil Steril. 2017. PMID: 28292620
-
Origin of Uterine Fibroids: Conversion of Myometrial Stem Cells to Tumor-Initiating Cells.Semin Reprod Med. 2017 Nov;35(6):481-486. doi: 10.1055/s-0037-1607205. Epub 2017 Nov 3. Semin Reprod Med. 2017. PMID: 29100235 Review. No abstract available.
-
Estrogenic effects of organochlorine pesticides on uterine leiomyoma cells in vitro.Toxicol Sci. 2000 Apr;54(2):355-64. doi: 10.1093/toxsci/54.2.355. Toxicol Sci. 2000. PMID: 10774817
-
An in vivo/in vitro model to assess endocrine disrupting activity of xenoestrogens in uterine leiomyoma.Ann N Y Acad Sci. 2001 Dec;948:100-11. doi: 10.1111/j.1749-6632.2001.tb03991.x. Ann N Y Acad Sci. 2001. PMID: 11795388 Review.
Cited by
-
Glucocorticoids regulate gene expression and repress cellular proliferation in human uterine leiomyoma cells.Horm Cancer. 2012 Jun;3(3):79-92. doi: 10.1007/s12672-012-0103-0. Horm Cancer. 2012. PMID: 22311344 Free PMC article.
-
EDC-2: The Endocrine Society's Second Scientific Statement on Endocrine-Disrupting Chemicals.Endocr Rev. 2015 Dec;36(6):E1-E150. doi: 10.1210/er.2015-1010. Epub 2015 Nov 6. Endocr Rev. 2015. PMID: 26544531 Free PMC article. Review.
-
An essential role of p27 downregulation in fenvalerate-induced cell growth in human uterine leiomyoma and smooth muscle cells.Am J Physiol Endocrinol Metab. 2012 Oct 15;303(8):E1025-35. doi: 10.1152/ajpendo.00107.2012. Epub 2012 Jul 31. Am J Physiol Endocrinol Metab. 2012. PMID: 22850687 Free PMC article.
-
Endocrine-Disrupting Chemicals and Disease Endpoints.Int J Mol Sci. 2023 Mar 10;24(6):5342. doi: 10.3390/ijms24065342. Int J Mol Sci. 2023. PMID: 36982431 Free PMC article. Review.
-
Halofuginone suppresses growth of human uterine leiomyoma cells in a mouse xenograft model.Hum Reprod. 2016 Jul;31(7):1540-51. doi: 10.1093/humrep/dew094. Epub 2016 Apr 29. Hum Reprod. 2016. PMID: 27130615 Free PMC article.
References
-
- Fenvalerate. WHO/FAO DATA Sheets on Pesticides. 1996. No. 90.
-
- Al-Hendy A, Lee EJ, Wang HQ, Copland JA. Gene therapy of uterine leiomyomas: adenovirus-mediated expression of dominant negative estrogen receptor inhibits tumor growth in nude mice. Am J Obstet Gynecol. 2004;191:1621–1631. - PubMed
-
- Arslan AA, Gold LI, Mittal K, Suen TC, Belitskaya-Levy I, Tang MS, Toniolo P. Gene expression studies provide clues to the pathogenesis of uterine leiomyoma: new evidence and a systematic review. Hum Reprod. 2005;20:852–863. - PubMed
Publication types
MeSH terms
Substances
Grants and funding
LinkOut - more resources
Full Text Sources
Medical
Research Materials
