

Differences in the control of breathing between Andean highlanders and lowlanders after 10 days acclimatization at 3850 m
- PMID: 20231143
- PMCID: PMC2876813
- DOI: 10.1113/jphysiol.2009.186064
Differences in the control of breathing between Andean highlanders and lowlanders after 10 days acclimatization at 3850 m
Abstract
We used Duffin's isoxic hyperoxic ( mmHg) and hypoxic ( mmHg) rebreathing tests to compare the control of breathing in eight (7 male) Andean highlanders and six (4 male) acclimatizing Caucasian lowlanders after 10 days at 3850 m. Compared to lowlanders, highlanders had an increased non-chemoreflex drive to breathe, characterized by higher basal ventilation at both hyperoxia (10.5 +/- 0.7 vs. 4.9 +/- 0.5 l min(1), P = 0.002) and hypoxia (13.8 +/- 1.4 vs. 5.7 +/- 0.9 l min(1), P < 0.001). Highlanders had a single ventilatory sensitivity to CO(2) that was lower than that of the lowlanders (P < 0.001), whose response was characterized by two ventilatory sensitivities (VeS1 and VeS2) separated by a patterning threshold. There was no difference in ventilatory recruitment thresholds (VRTs) between populations (P = 0.209). Hypoxia decreased VRT within both populations (highlanders: 36.4 +/- 1.3 to 31.7 +/- 0.7 mmHg, P < 0.001; lowlanders: 35.3 +/- 1.3 to 28.8 +/- 0.9 mmHg, P < 0.001), but it had no effect on basal ventilation (P = 0.12) or on ventilatory sensitivities in either population (P = 0.684). Within lowlanders, VeS2 was substantially greater than VeS1 at both isoxic tensions (hyperoxic: 9.9 +/- 1.7 vs. 2.8 +/- 0.2, P = 0.005; hypoxic: 13.2 +/- 1.9 vs. 2.8 +/- 0.5, P < 0.001), although hypoxia had no effect on either of the sensitivities (P = 0.192). We conclude that the control of breathing in Andean highlanders is different from that in acclimatizing lowlanders, although there are some similarities. Specifically, acclimatizing lowlanders have relatively lower non-chemoreflex drives to breathe, increased ventilatory sensitivities to CO(2), and an altered pattern of ventilatory response to CO(2) with two ventilatory sensitivities separated by a patterning threshold. Similar to highlanders and unlike lowlanders at sea-level, acclimatizing lowlanders respond to hypobaric hypoxia by decreasing their VRT instead of changing their ventilatory sensitivity to CO(2).
Figures
 and
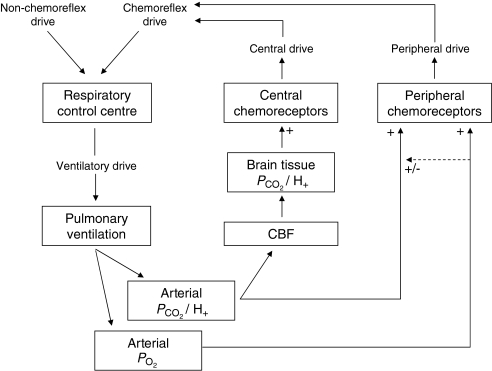
and  . Arterial [H+] is ‘sampled’ by the peripheral chemoreceptors located in the carotid bodies, where it determines the peripheral chemoreflex drive. Hypoxia exerts its effect on ventilation via peripheral chemoreceptors, where it acts indirectly via increasing the ventilatory sensitivity to [H+] in most individuals but may also act directly by increasing the overall activity of the receptor. Central chemoreceptors respond to changes in the local [H+] environment, which is affected by brain tissue
  . Brain tissue
  is a function of both arterial
  and cerebral blood flow, which acts to decrease the brain tissue
  at a higher flow (Berkenbosch et al. 1989; Mohan et al. 1999). The central and peripheral chemoreflex drives add together to form a total chemoreflex drive to breathe.
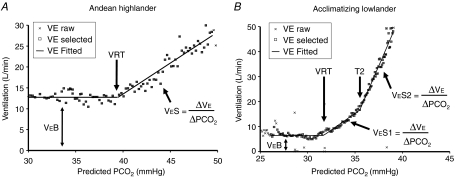
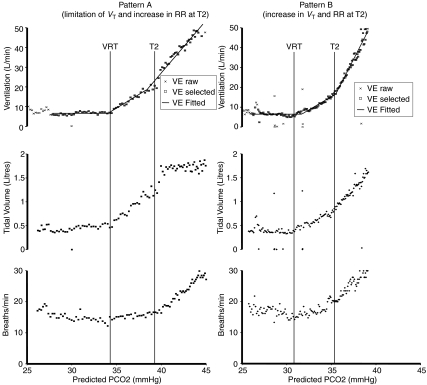
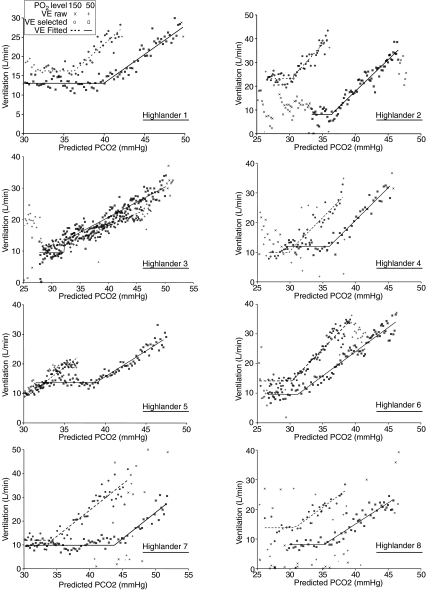
 at which there was a change in the slope of the ventilatory response to CO2 above VRT. In both populations, the first segment was fitted with either an exponential decline to a final value, or a mean, and measured sub-VRT ventilation (VeB) that represents non-chemoreflex ventilation drive. In highlanders, the second segment was fitted with a straight line where the slope measured the sensitivity (VeS). In lowlanders, the second and third segments were also fitted with straight lines where the slopes measured the first (VeS1) and second (VeS2) ventilatory sensitivities to CO2.
Similar articles
-
Differences in the control of breathing between Himalayan and sea-level residents.J Physiol. 2010 May 1;588(Pt 9):1591-606. doi: 10.1113/jphysiol.2009.185504. Epub 2010 Mar 1. J Physiol. 2010. PMID: 20194122 Free PMC article.
-
Global REACH 2018: The carotid artery diameter response to the cold pressor test is governed by arterial blood pressure during normoxic but not hypoxic conditions in healthy lowlanders and Andean highlanders.Exp Physiol. 2020 Oct;105(10):1742-1757. doi: 10.1113/EP088898. Epub 2020 Sep 10. Exp Physiol. 2020. PMID: 32829509
-
Strategies to improve respiratory chemoreflex characterization by Duffin's rebreathing.Exp Physiol. 2022 Dec;107(12):1507-1520. doi: 10.1113/EP090668. Epub 2022 Oct 25. Exp Physiol. 2022. PMID: 36177675
-
A narrative review of periodic breathing during sleep at high altitude: From acclimatizing lowlanders to adapted highlanders.J Physiol. 2024 Nov;602(21):5435-5448. doi: 10.1113/JP285427. Epub 2024 Mar 27. J Physiol. 2024. PMID: 38534039 Review.
-
The impact of hypoxaemia on vascular function in lowlanders and high altitude indigenous populations.J Physiol. 2019 Dec;597(24):5759-5776. doi: 10.1113/JP277191. Epub 2019 Nov 28. J Physiol. 2019. PMID: 31677355 Review.
Cited by
-
Time Domains of the Hypoxic Ventilatory Response and Their Molecular Basis.Compr Physiol. 2016 Jun 13;6(3):1345-85. doi: 10.1002/cphy.c150026. Compr Physiol. 2016. PMID: 27347896 Free PMC article. Review.
-
Adjustment Criteria for Air-Quality Standards by Altitude: A Scoping Review with Regulatory Overview.Int J Environ Res Public Health. 2025 Jun 30;22(7):1053. doi: 10.3390/ijerph22071053. Int J Environ Res Public Health. 2025. PMID: 40724120 Free PMC article. Review.
-
The accuracy of a near-infrared spectroscopy cerebral oximetry device and its potential value for estimating jugular venous oxygen saturation.Anesth Analg. 2014 Dec;119(6):1381-92. doi: 10.1213/ANE.0000000000000463. Anesth Analg. 2014. PMID: 25313967 Free PMC article.
-
Geographic components of SARS-CoV-2 expansion: a hypothesis.J Appl Physiol (1985). 2020 Aug 1;129(2):257-262. doi: 10.1152/japplphysiol.00362.2020. Epub 2020 Jul 23. J Appl Physiol (1985). 2020. PMID: 32702272 Free PMC article. Review.
-
Evolved changes in breathing and CO2 sensitivity in deer mice native to high altitudes.Am J Physiol Regul Integr Comp Physiol. 2018 Nov 1;315(5):R1027-R1037. doi: 10.1152/ajpregu.00220.2018. Epub 2018 Sep 5. Am J Physiol Regul Integr Comp Physiol. 2018. PMID: 30183337 Free PMC article.
References
-
- Ainslie PN, Burgess KR. Cardiorespiratory and cerebrovascular responses to hyperoxic and hypoxic rebreathing: effects of acclimatization to high altitude. Respir Physiol Neurobiol. 2008;161:201–209. - PubMed
-
- Ainslie PN, Duffin J. Integration of cerebrovascular CO2 reactivity and chemoreflex control of breathing: mechanisms of regulation, measurement, and interpretation. Am J Physiol Regul Integr Comp Physiol. 2009;296:R1473–R1495. - PubMed
-
- Ainslie PN, Kolb JC, Ide K, Poulin MJ. Effects of five nights of normobaric hypoxia on the ventilatory responses to acute hypoxia and hypercapnia. Respir Physiol Neurobiol. 2003;138:193–204. - PubMed
-
- Aldenderfer MS. Moving up in the world. Am Sci. 2003;91:542–549.
-
- Appenzeller O, Claydon VE, Gulli G, Qualls C, Slessarev M, Zenebe G, Gebremedhin A, Hainsworth R. Cerebral vasodilatation to exogenous NO is a measure of fitness for life at altitude. Stroke. 2006;37:1754–1758. - PubMed
MeSH terms
Substances
LinkOut - more resources
Full Text Sources
Miscellaneous