

Glucose suppression of glucagon secretion: metabolic and calcium responses from alpha-cells in intact mouse pancreatic islets
- PMID: 20231269
- PMCID: PMC2863245
- DOI: 10.1074/jbc.M109.069195
Glucose suppression of glucagon secretion: metabolic and calcium responses from alpha-cells in intact mouse pancreatic islets
Abstract
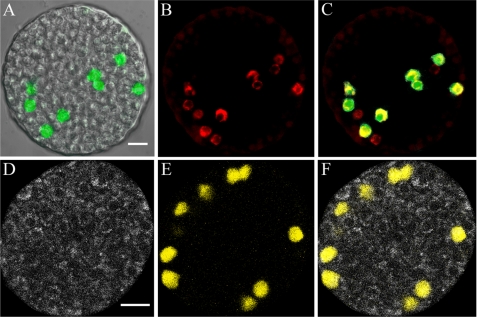
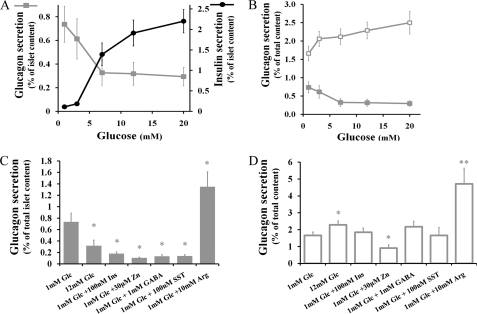
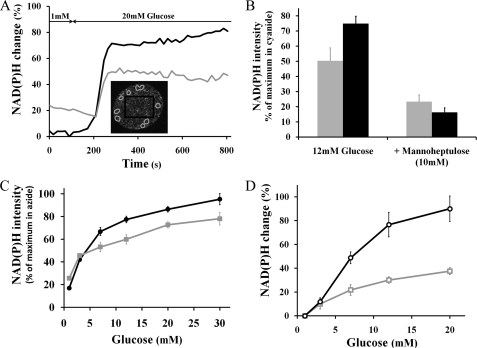
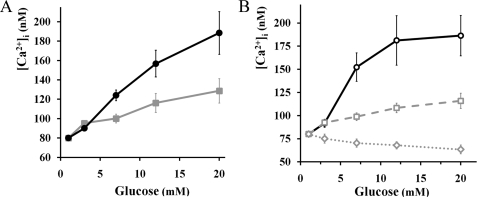
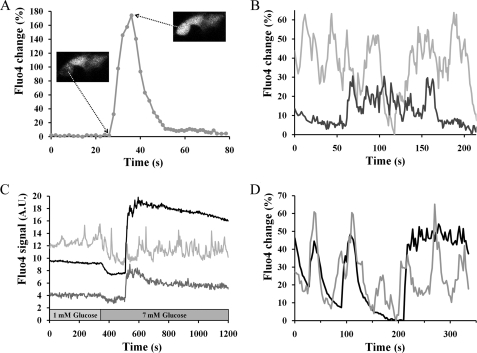
Glucagon is released from alpha-cells present in intact pancreatic islets at glucose concentrations below 4 mm, whereas higher glucose levels inhibit its secretion. The mechanisms underlying the suppression of alpha-cell secretory activity are poorly understood, but two general types of models have been proposed as follows: direct inhibition by glucose or paracrine inhibition from non-alpha-cells within the islet of Langerhans. To identify alpha-cells for analysis, we utilized transgenic mice expressing fluorescent proteins targeted specifically to these cells. Measurements of glucagon secretion from pure populations of flow-sorted alpha-cells show that contrary to its effect on intact islets, glucose does stimulate glucagon secretion from isolated alpha-cells. This observation argues against a direct inhibition of glucagon secretion by glucose and supports the paracrine inhibition model. Imaging of cellular metabolism by two-photon excitation of NAD(P)H autofluorescence indicates that glucose is metabolized in alpha-cells and that glucokinase is the likely rate-limiting step in this process. Imaging calcium dynamics of alpha-cells in intact islets reveals that inhibiting concentrations of glucose increase the intracellular calcium concentration and the frequency of alpha-cell calcium oscillations. Application of candidate paracrine inhibitors leads to reduced glucagon secretion but did not decrease the alpha-cell calcium activity. Taken together, the data suggest that suppression occurs downstream from alpha-cell calcium signaling, presumably at the level of vesicle trafficking or exocytotic machinery.
Figures
Similar articles
-
Transcriptomic profiling of pancreatic alpha, beta and delta cell populations identifies delta cells as a principal target for ghrelin in mouse islets.Diabetologia. 2016 Oct;59(10):2156-65. doi: 10.1007/s00125-016-4033-1. Epub 2016 Jul 7. Diabetologia. 2016. PMID: 27390011 Free PMC article.
-
Glucose inhibits glucagon secretion by a direct effect on mouse pancreatic alpha cells.Diabetologia. 2007 Feb;50(2):370-9. doi: 10.1007/s00125-006-0511-1. Epub 2006 Nov 29. Diabetologia. 2007. PMID: 17136393
-
Glucose- and hormone-induced cAMP oscillations in α- and β-cells within intact pancreatic islets.Diabetes. 2011 May;60(5):1535-43. doi: 10.2337/db10-1087. Epub 2011 Mar 28. Diabetes. 2011. PMID: 21444924 Free PMC article.
-
Regulation of islet glucagon secretion: Beyond calcium.Diabetes Obes Metab. 2018 Sep;20 Suppl 2(Suppl 2):127-136. doi: 10.1111/dom.13381. Diabetes Obes Metab. 2018. PMID: 30230183 Free PMC article. Review.
-
Inhibition of glucagon secretion.Adv Pharmacol. 2005;52:151-71. doi: 10.1016/S1054-3589(05)52008-8. Adv Pharmacol. 2005. PMID: 16492545 Review.
Cited by
-
Is zinc an intra-islet regulator of glucagon secretion?Diabetol Int. 2016 Feb 27;7(2):106-110. doi: 10.1007/s13340-016-0259-x. eCollection 2016 Jun. Diabetol Int. 2016. PMID: 30603252 Free PMC article.
-
Mini-review: Glucagon responses in type 1 diabetes - a matter of complexity.Physiol Rep. 2021 Aug;9(16):e15009. doi: 10.14814/phy2.15009. Physiol Rep. 2021. PMID: 34405569 Free PMC article. Review.
-
Somatostatin and insulin mediate glucose-inhibited glucagon secretion in the pancreatic α-cell by lowering cAMP.Am J Physiol Endocrinol Metab. 2015 Jan 15;308(2):E130-43. doi: 10.1152/ajpendo.00344.2014. Epub 2014 Nov 18. Am J Physiol Endocrinol Metab. 2015. PMID: 25406263 Free PMC article.
-
BAD modulates counterregulatory responses to hypoglycemia and protective glucoprivic feeding.PLoS One. 2011;6(12):e28016. doi: 10.1371/journal.pone.0028016. Epub 2011 Dec 5. PLoS One. 2011. PMID: 22162752 Free PMC article.
-
Stathmin-2 Mediates Glucagon Secretion From Pancreatic α-Cells.Front Endocrinol (Lausanne). 2020 Feb 4;11:29. doi: 10.3389/fendo.2020.00029. eCollection 2020. Front Endocrinol (Lausanne). 2020. PMID: 32117057 Free PMC article.
References
-
- Unger R. H. (1981) Diabetologia 20, 1–11 - PubMed
-
- Wierup N., Svensson H., Mulder H., Sundler F. (2002) Regul. Pept. 107, 63–69 - PubMed
-
- Jiang G., Zhang B. B. (2003) Am. J. Physiol. Endocrinol. Metab. 284, E671–E678 - PubMed
-
- Matsuda M., Defronzo R. A., Glass L., Consoli A., Giordano M., Bressler P., Delprato S. (2002) Metabolism 51, 1111–1119 - PubMed
-
- Cryer P. E., Davis S. N., Shamoon H. (2003) Diabetes Care 26, 1902–1912 - PubMed
Publication types
MeSH terms
Substances
Grants and funding
- P60 DK020593/DK/NIDDK NIH HHS/United States
- GM72048/GM/NIGMS NIH HHS/United States
- DK58404/DK/NIDDK NIH HHS/United States
- P30 DK058404/DK/NIDDK NIH HHS/United States
- RR25649/RR/NCRR NIH HHS/United States
- S10 RR025649/RR/NCRR NIH HHS/United States
- P30 DK020593/DK/NIDDK NIH HHS/United States
- DK53434/DK/NIDDK NIH HHS/United States
- P30 CA068485/CA/NCI NIH HHS/United States
- R01 DK053434/DK/NIDDK NIH HHS/United States
- CA68485/CA/NCI NIH HHS/United States
- DK20593/DK/NIDDK NIH HHS/United States
- P20 GM072048/GM/NIGMS NIH HHS/United States
LinkOut - more resources
Full Text Sources
Molecular Biology Databases
