

Escherichia coli alpha-hemolysin triggers shrinkage of erythrocytes via K(Ca)3.1 and TMEM16A channels with subsequent phosphatidylserine exposure
- PMID: 20231275
- PMCID: PMC2865299
- DOI: 10.1074/jbc.M109.082578
Escherichia coli alpha-hemolysin triggers shrinkage of erythrocytes via K(Ca)3.1 and TMEM16A channels with subsequent phosphatidylserine exposure
Abstract
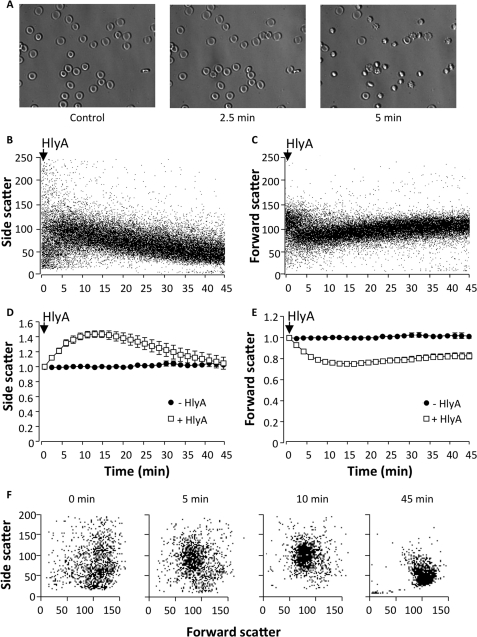
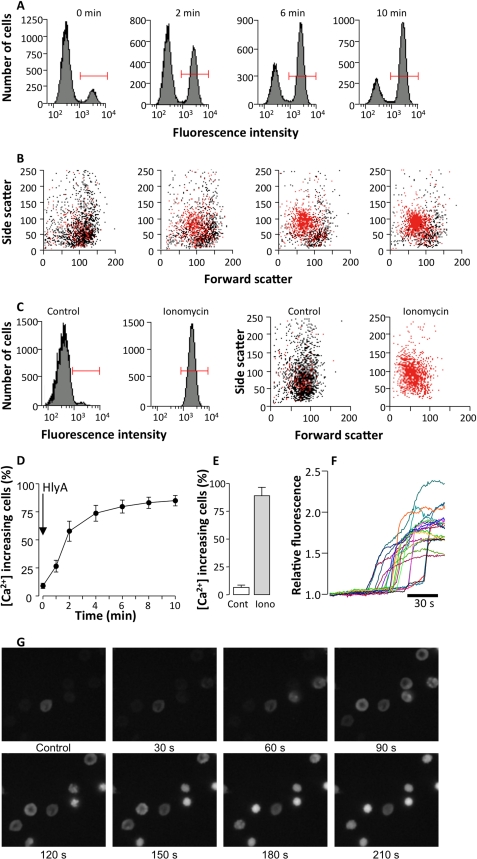
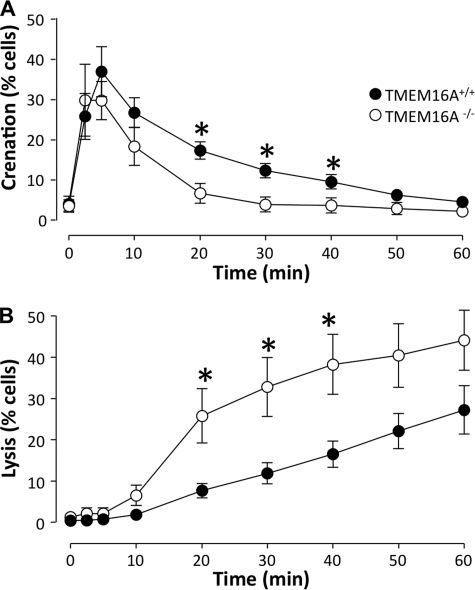
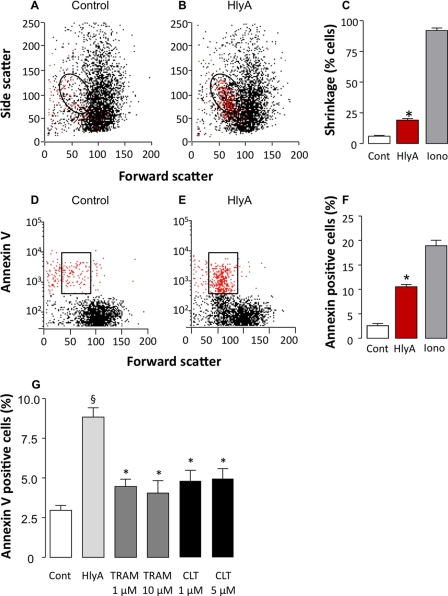
alpha-Hemolysin from Escherichia coli (HlyA) readily lyse erythrocytes from various species. We have recently demonstrated that this pore-forming toxin provokes distinct shrinkage and crenation before it finally leads to swelling and lysis of erythrocytes. The present study documents the underlying mechanism for this severe volume reduction. We show that HlyA-induced shrinkage and crenation of human erythrocytes occur subsequent to a significant rise in [Ca(2+)](i). The Ca(2+)-activated K(+) channel K(Ca)3.1 (or Gardos channel) is essential for the initial shrinkage, because both clotrimazole and TRAM-34 prevent the shrinkage and potentiate hemolysis produced by HlyA. Notably, the recently described Ca(2+)-activated Cl(-) channel TMEM16A contributes substantially to HlyA-induced cell volume reduction. Erythrocytes isolated from TMEM16A(-/-) mice showed significantly attenuated crenation and increased lysis compared with controls. Additionally, we found that HlyA leads to acute exposure of phosphatidylserine in the outer leaflet of the plasma membrane. This exposure was considerably reduced by K(Ca)3.1 antagonists. In conclusion, this study shows that HlyA triggers acute erythrocyte shrinkage, which depends on Ca(2+)-activated efflux of K(+) via K(Ca)3.1 and Cl(-) via TMEM16A, with subsequent phosphatidylserine exposure. This mechanism might potentially allow HlyA-damaged erythrocytes to be removed from the bloodstream by macrophages and thereby reduce the risk of intravascular hemolysis.
Figures

Similar articles
-
P2X receptor-dependent erythrocyte damage by α-hemolysin from Escherichia coli triggers phagocytosis by THP-1 cells.Toxins (Basel). 2013 Mar 5;5(3):472-87. doi: 10.3390/toxins5030472. Toxins (Basel). 2013. PMID: 23462688 Free PMC article.
-
Loop Diuretics Diminish Hemolysis Induced by α-Hemolysin from Escherichia coli.J Membr Biol. 2017 Jun;250(3):301-313. doi: 10.1007/s00232-017-9963-0. Epub 2017 May 9. J Membr Biol. 2017. PMID: 28488084
-
Regulation of extracellular ATP of human erythrocytes treated with α-hemolysin. Effects of cell volume, morphology, rheology and hemolysis.Biochim Biophys Acta Mol Cell Res. 2019 May;1866(5):896-915. doi: 10.1016/j.bbamcr.2019.01.018. Epub 2019 Feb 3. Biochim Biophys Acta Mol Cell Res. 2019. PMID: 30726708
-
Mechanisms and significance of eryptosis.Antioxid Redox Signal. 2006 Jul-Aug;8(7-8):1183-92. doi: 10.1089/ars.2006.8.1183. Antioxid Redox Signal. 2006. PMID: 16910766 Review.
-
Pore-formation by Escherichia coli hemolysin (HlyA) and other members of the RTX toxins family.Toxicology. 1994 Feb 28;87(1-3):249-67. doi: 10.1016/0300-483x(94)90254-2. Toxicology. 1994. PMID: 8160187 Review.
Cited by
-
Alpha hemolysin induces an increase of erythrocytes calcium: a FLIM 2-photon phasor analysis approach.PLoS One. 2011;6(6):e21127. doi: 10.1371/journal.pone.0021127. Epub 2011 Jun 16. PLoS One. 2011. PMID: 21698153 Free PMC article.
-
Characterization of Campylobacter jejuni proteome profiles in co-incubation scenarios.Front Microbiol. 2023 Nov 9;14:1247211. doi: 10.3389/fmicb.2023.1247211. eCollection 2023. Front Microbiol. 2023. PMID: 38029072 Free PMC article.
-
P2X receptor stimulation amplifies complement-induced haemolysis.Pflugers Arch. 2013 Apr;465(4):529-41. doi: 10.1007/s00424-012-1174-z. Epub 2012 Nov 14. Pflugers Arch. 2013. PMID: 23149487
-
Erythrocyte P2X1 receptor expression is correlated with change in haematocrit in patients admitted to the ICU with blood pathogen-positive sepsis.Crit Care. 2018 Aug 2;22(1):181. doi: 10.1186/s13054-018-2100-3. Crit Care. 2018. PMID: 30071869 Free PMC article.
-
Bacterial RTX toxins allow acute ATP release from human erythrocytes directly through the toxin pore.J Biol Chem. 2014 Jul 4;289(27):19098-109. doi: 10.1074/jbc.M114.571414. Epub 2014 May 23. J Biol Chem. 2014. PMID: 24860098 Free PMC article.
References
Publication types
MeSH terms
Substances
LinkOut - more resources
Full Text Sources
Molecular Biology Databases
Miscellaneous
