. 2010 May 7;285(19):14534-48.
doi: 10.1074/jbc.M110.115345. Epub 2010 Mar 15.

Epigenetic regulatory mechanisms distinguish retinoic acid-mediated transcriptional responses in stem cells and fibroblasts

Affiliations

Epigenetic regulatory mechanisms distinguish retinoic acid-mediated transcriptional responses in stem cells and fibroblasts

Vasundhra Kashyap et al. J Biol Chem. .

Abstract

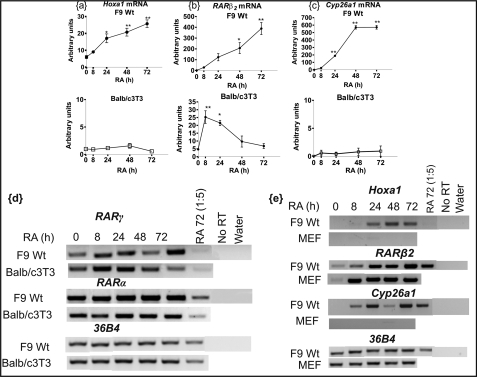
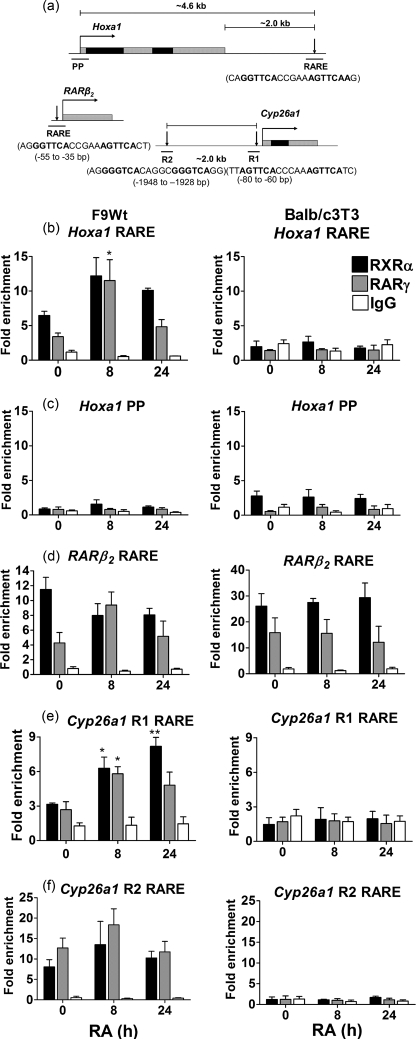
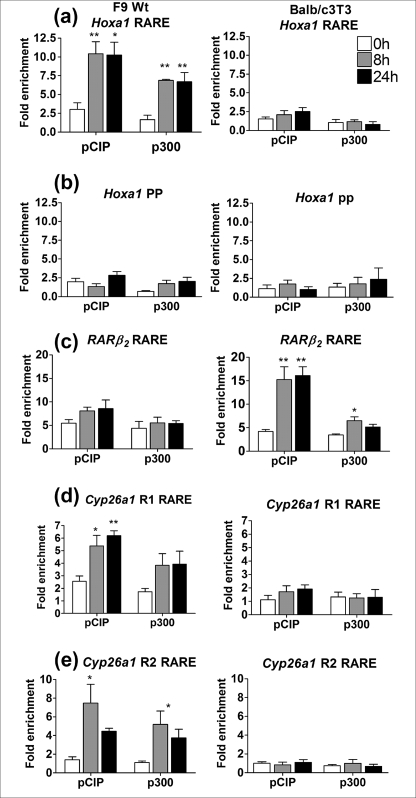
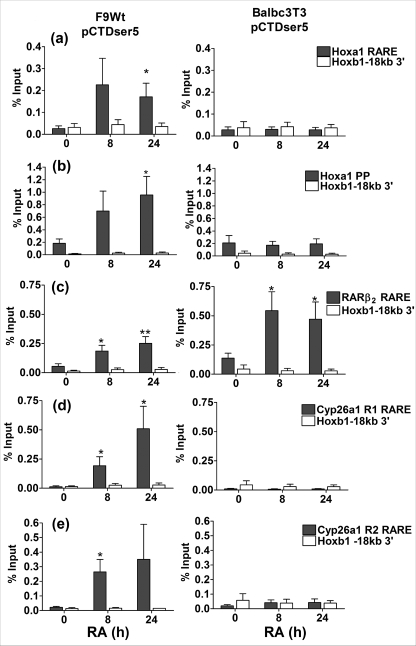
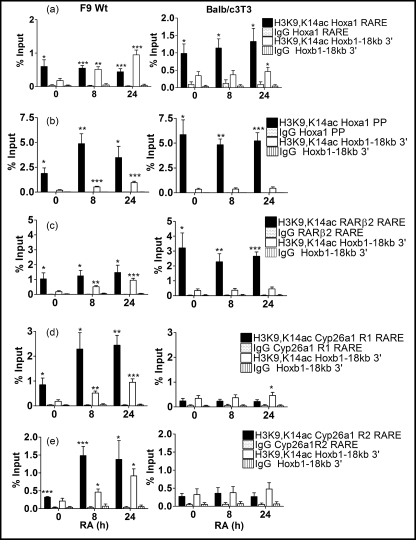
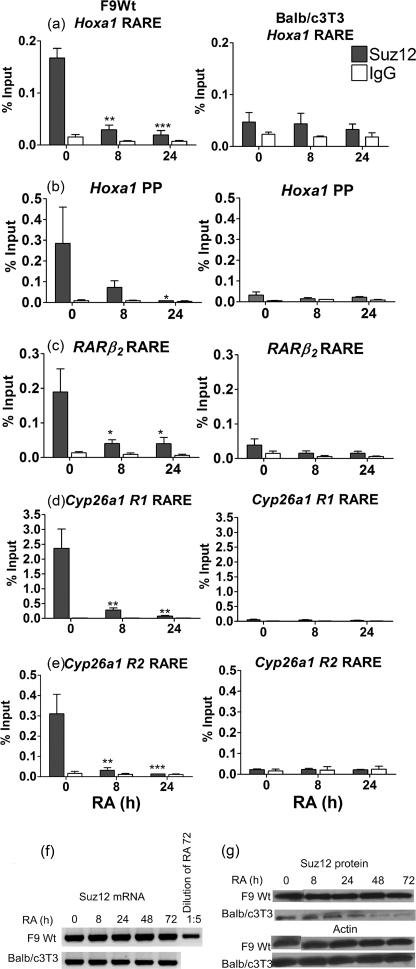
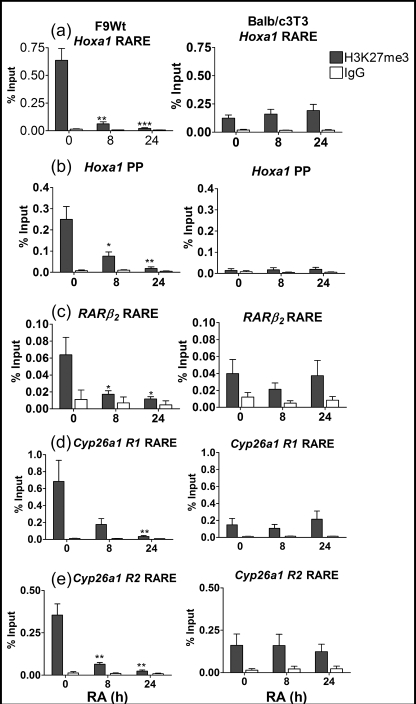
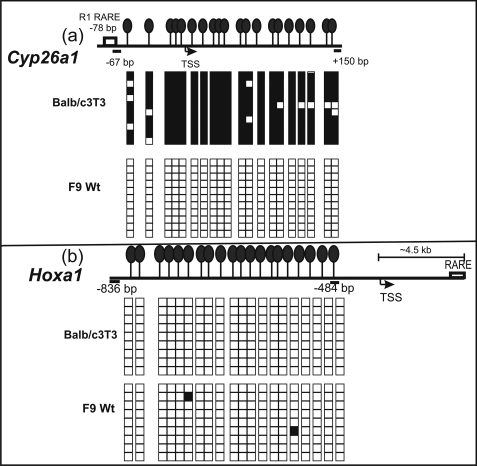
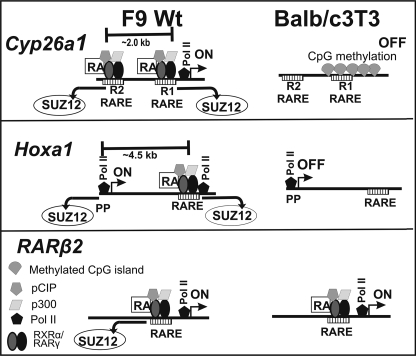
Retinoic acid (RA), a vitamin A metabolite, regulates transcription by binding to RA receptor (RAR) and retinoid X receptor (RXR) heterodimers. This transcriptional response is determined by receptor interactions with transcriptional regulators and chromatin modifying proteins. We compared transcriptional responses of three RA target genes (Hoxa1, Cyp26a1, RARbeta(2)) in primary embryo fibroblasts (mouse embryonic fibroblasts), immortalized fibroblasts (Balb/c3T3), and F9 teratocarcinoma stem cells. Hoxa1 and Cyp26a1 transcripts are not expressed, but RARbeta(2) transcripts are induced by RA in mouse embryonic fibroblasts and Balb/c3T3 cells. Retinoid receptors (RARgamma, RXRalpha), coactivators (pCIP (NCOA3, SRC3)), and p300 and RNA polymerase II are recruited only to the RARbeta(2) RA response element (RARE) in Balb/c3T3, whereas these proteins are recruited to RAREs of all three genes by RA in F9 cells. In F9, RA reduces polycomb (PcG) protein Suz12 and the associated H3K27me3 repressive epigenetic modification at the RAREs of all three genes. In contrast, in Balb/c3T3 cells cultured in the +/-RA, Suz12 is not associated with the Hoxa1, RARbeta(2), and Cyp26a1 RAREs, whereas slow levels of the H3K27me3 mark are seen at these RAREs. Thus, Suz12 is not required for gene repression in the absence of RA. Even though the Hoxa1 RARE and proximal promoter show high levels of H3K9,K14 acetylation in Balb/c3T3, the Hoxa1 gene is not transcriptionally activated by RA. In Balb/c3T3, CpG islands are methylated in the Cyp26a1 promoter region but not in the Hoxa1 promoter or in these promoters in F9 cells. We have delineated the complex mechanisms that control RA-mediated transcription in fibroblasts versus stem cells.


Figures

FIGURE 1.
FIGURE 1.
a–c, RA regulated induction of Cyp26a1, Hoxa1, and RARβ2 transcripts in F9 Wt and Balb/c3T3 cells is shown. RNA was harvested from F9 Wt and Balb/c3T3 cells treated with 1 μm RA for different time points (0, 8, 24, 48, and 72 h) and reverse-transcribed to generate cDNA. The cDNA obtained was utilized for real time PCR (quantitative) analysis. Real time PCR data for the three genes were plotted (in arbitrary units) relative to the 36B4 mRNA at each point. Experiments were performed at least three times using independent RNA samples, and similar results were obtained in each independent experiment. Real time PCR was done in triplicate, and the results are representative of two independent biological experiments (mean ± S.E.). The asterisks depict significance, where 1 asterisk denotes p < 0.05 and 2 asterisks denote p < 0.01. d, time course of RARα and RARγ mRNA induction in F9 Wt and Balb/c3T3 cells is shown. RNA was harvested from F9 Wt and Balb/c3T3 cells treated with 1 μm RA for different times (0, 8, 24, 48, and 72 h) and reverse-transcribed to cDNA. The cDNA obtained was utilized for semiquantitative PCR analysis. PCR products were visualized by running them on a 1.5% agarose gel stained with ethidium bromide. e, time course of mRNA induction of Cyp26a1, Hoxa1, and RARβ2 in F9 Wt cells and primary MEFs is shown. RNA was harvested from F9 Wt, and MEFs were treated with 1 μm RA for different times (0, 8, 24, 48, and 72 h) and reverse-transcribed to form cDNA. The cDNA obtained was utilized for semiquantitative PCR analysis. PCR products were visualized by running them on a 1.5% agarose gel stained with ethidium bromide.
FIGURE 2.
FIGURE 2.
Association of RARγ and RXRα with Hoxa1, RARβ2, and Cyp26a1 RAREs in F9 Wt and Balb/c3T3 cells. a, shown is a schematic representation of the gene structures of Hoxa1, Cyp26a1, and RARβ2. The black line depicts DNA. Gray boxes denote introns, and exons are represented by black boxes. RAREs located within each gene have been depicted by arrows, and the actual binding sites are indicated in bold letters. Thick black bars underneath the RAREs indicate the regions amplified in ChIP assays. The transcription start site is indicated in each gene by bent arrows. The figure is drawn to scale. b–f, F9 Wt and Balb/c3T3 cells were treated with RA for different times (0, 8, and 24 h) and then cross-linked using the two-step cross-linking procedure. The cells were first incubated with 2 mm disuccinimidyl glutarate for 45 min with gentle shaking followed by fixation with 1% formaldehyde. Cross-linked cells were harvested and lysed in lysis buffer and sonicated to obtain soluble chromatin. Chromatin from ∼3.5 × 10⁶ cells was used for each IP, and chromatin samples were precleared with protein A-Sepharose beads. Precleared chromatin was immunoprecipitated with RARγ, RXRα, and IgG antibodies overnight. Bound chromatin was pulled down by protein A-Sepharose beads, washed, eluted, reverse cross-linked, and purified. Immunoprecipitated DNA (2 μl) was used for real time PCR. Experiments were repeated at least three times starting with cells, and quantitative PCR was performed in triplicate. The data are plotted as -fold enrichment, which is defined as the percentage of input DNA immunoprecipitated at a specific locus divided by the percentage of input DNA immunoprecipitated at the nonspecific region (Hoxb1-18 kb 3′) in the same IP. Data were statistically analyzed using Graphpad Prism 4.0, and error bars indicate S.E. over independent replicate experiments. The asterisks depict significance, where 1 asterisk denotes p < 0.05 and 2 asterisks denote p < 0.01. p values indicate statistically significant changes after RA treatment within each cell line compared with the untreated controls for that cell line. Note the differences in the y axis scale in panel d between F9 Wt and Balb/c3T3 cells.
FIGURE 3.
FIGURE 3.
Coactivator recruitment (pCIP and p300) at Hoxa1, RARβ2, and Cyp26a1 RAREs in F9 Wt and Balb/c3T3 cells upon RA treatment. F9 Wt and Balb/c3T3 cells were treated with RA for different times (0, 8, and 24 h) and fixed with 1% formaldehyde. Cells were lysed and sonicated to obtain soluble chromatin. Chromatin was precleared and immunoprecipitated with anti-pCIP or anti-p300 antibodies, and the immunoprecipitated DNA was quantitated using real time PCR. Each experiment was repeated at least three times, starting with cells, and quantitative PCR was performed in triplicate. The data are plotted as -fold enrichment, which is defined as the percentage of input DNA immunoprecipitated at a specific locus divided by the percentage of input DNA immunoprecipitated at the nonspecific region (Hoxb1-18 kb 3′) in the same IP. Mean -fold enrichment was calculated, and error bars represent the S.E. over independent replicate experiments. 1 asterisk denotes p < 0.05, and 2 asterisks denote p < 0.01. p values indicate significant changes after RA treatment within each cell line compared with the untreated control for that cell line.
FIGURE 4.
FIGURE 4.
Recruitment of Pol II at Hoxa1, RARβ2, and Cyp26a1 RAREs in F9 Wt and Balb/c3T3 cells upon RA treatment. F9 Wt and Balb/c3T3 cells were treated with RA for different times (0, 8, and 24 h) and fixed with 1% formaldehyde. Cells were lysed and sonicated to obtain soluble chromatin. Chromatin was precleared and immunoprecipitated with anti-pCTDser5 antibody, and the immunoprecipitated DNA was quantitated using real time PCR. Experiments were performed at least three times, starting with cell culture, and quantitative PCR was performed in triplicate. The data are averaged and plotted as a percentage of the immunoprecipitated DNA, with the reference to the percentage of input DNA at each locus. The error bars represent S.E. over independent replicate experiments. The percentage of input DNA immunoprecipitated in the same IP at Hoxb1-18 kb 3′ region is also graphed for comparison as a negative control. 1 asterisk denotes p < 0.05, and two asterisks denotes p < 0.01. p values indicate significant changes after RA treatment within each cell line compared with the untreated controls for that cell line. Note that at the Hoxa1 PP region the levels of Pol II are similar in Balb/c3T3 cells cultured in the presence and absence of RA but are statistically significantly higher than those in the Hoxb1-18 kb 3′ region (p < 0.05).
FIGURE 5.
FIGURE 5.
Histone acetylation status at Hoxa1, RARβ2, and Cyp26a1 RAREs in F9 Wt and Balb/c3T3 cells in response to RA treatment. F9 Wt and Balb/c3T3 cells were treated with RA for different times (0, 8, and 24 h) and fixed with 1% formaldehyde. Cells were lysed and sonicated to obtain soluble chromatin. Chromatin was precleared and immunoprecipitated with anti-H3K9,K14ac, and immunoprecipitated DNA was quantitated using real time PCR. Experiments were repeated at least three times, starting with cell culture, and quantitative PCR was performed in triplicate. The data are averaged and plotted as a percentage of immunoprecipitated DNA with reference to the percentage of input DNA at each locus. The error bars represent the S.E. over independent replicate experiments. The percentage of input immunoprecipitated in the same chromatin extracts with nonspecific IgG negative control and the percentage of input immunoprecipitated at the Hoxb1-18 kb 3′ region is also graphed for comparison. 1 asterisk denotes p < 0.05, two asterisks denote p < 0.01, and three asterisks denote p < 0.0005. p values indicate significant levels of H3K9,K14ac as compared with IgG control at each locus (including Hoxb1-18 kb 3′ region) within each cell line.
FIGURE 6.
FIGURE 6.
a–e, Suz12 recruitment at the Hoxa1, RARβ2, and Cyp26a1 RAREs in F9 Wt and Balb/c3T3 cells in response to RA treatment is shown. F9 Wt and Balb/c3T3 cells were treated with RA for different times (0, 8, and 24 h) and fixed with 1% formaldehyde. Cells were lysed and sonicated to obtain soluble chromatin. Chromatin was precleared and immunoprecipitated with anti-SUZ12 antibody, and immunoprecipitated DNA was quantitated using real time PCR. Experiments were repeated at least three times, starting with cell culture, and quantitative PCR was performed in triplicate. The data are averaged and plotted as a percentage of immunoprecipitated DNA with reference to the percentage of input DNA at each locus. The error bars represent the S.E. over independent replicate experiments. The percentage of input immunoprecipitated in the same chromatin extracts with nonspecific IgG is also graphed for comparison as a negative control. 1 asterisk denotes p < 0.05, and two asterisks denote p < 0.01. p values indicate statistically significant changes after RA treatment within each cell line compared with the untreated controls for that cell line. f, Suz12 mRNA levels in F9 Wt cells and Balb/c3T3 cells are shown. RNA was harvested from F9 Wt and Balb/c3T3 cells treated with 1 μm RA for different times (0, 8, 24, 48, and 72 h) and reverse-transcribed to form cDNA. The cDNA obtained was utilized for semiquantitative PCR analysis. PCR products were visualized by running them on a 1.5% agarose gel stained with ethidium bromide. g, expression of Suz12 protein in F9 Wt and Balb/c3T3 cells is shown. Cell lysates were harvested from F9 Wt and Balb/c3T3 cells treated with 1 μm RA for different times (0, 8, 24, 48, and 72 h). Whole cell extracts (60 μg) were separated on 10% SDS-PAGE followed by Western blot analysis with anti-Suz12 (1:1000). Immunoblot with the β actin antibody (1:1000) served as the loading control.
FIGURE 7.
FIGURE 7.
H3K27me3 levels at Hoxa1, RARβ2, and Cyp26a1 RAREs in F9 Wt and Balb/c3T3 cells in response to RA treatment. F9 Wt and Balb/c3T3 cells were treated with RA for different times (0, 8, and 24 h) and fixed with 1% formaldehyde. Cells were lysed and sonicated to obtain soluble chromatin. Chromatin was precleared and immunoprecipitated with anti-H3K27me3 antibody, and immunoprecipitated DNA was quantitated using real time PCR. Experiments were repeated at least three times starting with the cell culture, and quantitative PCR was performed in triplicates. The data are averaged and plotted as a percentage of immunoprecipitated DNA, with reference to the percentage of input DNA at each locus. The error bars represent the S.E. over independent replicate experiments. The percentage of input immunoprecipitated in the same IP with nonspecific IgG is also graphed for comparison as a negative control. p values indicate significant changes after RA treatment within each cell line compared with the untreated controls. Note that at the Hoxa1, RARβ2, and Cyp26a1 RAREs, the levels of H3K27me3 are similar in Balb/c3T3 cells cultured in the presence and absence of RA and are statistically significantly higher than those in the IgG negative controls (p < 0.05).
FIGURE 8.
FIGURE 8.
CpG methylation status of the Cyp26a1 (a) and Hoxa1 (b) proximal promoter regions. Genomic DNA was isolated from F9 Wt and Balb/c3T3 cells and was modified by bisulfite treatment. Bisulfite-specific primers were designed spanning the CpG islands near the TSS of Cyp26a1 and Hoxa1. The CpG island region used was annotated in the University of California Santa Cruz genome browser. Black squares indicate methylated CpGs, whereas white squares correspond to unmethylated CpGs. The data are from the sequences derived from multiple colonies generated after transformation. The gene is represented by the horizontal line, and the positions of the CpG dinucleotides are indicated by the oval circles above the gene. The forward and reverse primers are indicated by the horizontal lines below the gene. The figure is not drawn to scale.
FIGURE 9.
FIGURE 9.
Model for differential transcriptional regulation of three RA regulated genes in F9 Wt and Balb/c3T3 cells. Upon initiation of RA signaling, the PcG protein Suz12 is displaced from the RAREs of Hoxa1, Cyp26a1, and RARβ2 genes and the Hoxa1 PP region in F9 Wt cells. However, low levels of the PcG-mediated H3K27me3 modification are associated with the Cyp26a1 and Hoxa1 RAREs in Balb/c3T3 cells (not depicted). There is no association of RARγ and RXRα, coactivators, and RNA Pol II at the Hoxa1 RARE and Cyp26a1 RAREs in Balb/c3T3 cells, in contrast to the situation in F9 Wt cells. This is consistent with the RA-mediated transcriptional activation of Hoxa1 and Cyp26a1 in F9 Wt cells but not in Balb/c3T3 cells. The CpG islands in the Cyp26a1 gene are methylated only in Balb/c3T3 cells, correlating with the lack of transcriptional response. RARγ and RXRα are bound at the RARβ2 RARE in both F9 Wt and Balb/c3T3 cells in the absence and presence of RA. The coactivators pCIP and p300 and RNA Pol II are recruited to the RARβ2RARE in Balb/c3T3 cells, similar to the case in F9 Wt cells, and this corresponds to transcriptional activation by RA in both cell types.

Similar articles

Cited by

References

    1. Niederreither K., Dollé P. (2008) Nat. Rev. Genet. 9, 541–553 - PubMed
    1. Gudas L. J. (1994) J. Biol. Chem. 269, 15399–15402 - PubMed
    1. Blomhoff R., Blomhoff H. K. (2006) J. Neurobiol. 66, 606–630 - PubMed
    1. Bastien J., Rochette-Egly C. (2004) Gene 328, 1–16 - PubMed
    1. Kastner P., Mark M., Ghyselinck N., Krezel W., Dupé V., Grondona J. M., Chambon P. (1997) Development 124, 313–326 - PubMed

Publication types

MeSH terms

LinkOut - more resources