. 2010 May 14;285(20):15430-15439.
doi: 10.1074/jbc.M110.110593. Epub 2010 Mar 15.

Acute modulation of sugar transport in brain capillary endothelial cell cultures during activation of the metabolic stress pathway

Affiliations

Acute modulation of sugar transport in brain capillary endothelial cell cultures during activation of the metabolic stress pathway

Anthony J Cura et al. J Biol Chem. .

Abstract

GLUT1-catalyzed equilibrative sugar transport across the mammalian blood-brain barrier is stimulated during acute and chronic metabolic stress; however, the mechanism of acute transport regulation is unknown. We have examined acute sugar transport regulation in the murine brain microvasculature endothelial cell line bEnd.3. Acute cellular metabolic stress was induced by glucose depletion, by potassium cyanide, or by carbonyl cyanide p-trifluoromethoxyphenylhydrazone, which reduce or deplete intracellular ATP within 15 min. This results in a 1.7-7-fold increase in V(max) for zero-trans 3-O-methylglucose uptake (sugar uptake into sugar-free cells) and a 3-10-fold increase in V(max) for equilibrium exchange transport (intracellular [sugar] = extracellular [sugar]). GLUT1, GLUT8, and GLUT9 mRNAs are detected in bEnd.3 cells where GLUT1 mRNA levels are 33-fold greater than levels of GLUT8 or GLUT9 mRNA. Neither GLUT1 mRNA nor total protein levels are affected by acute metabolic stress. Cell surface biotinylation reveals that plasma membrane GLUT1 levels are increased 2-3-fold by metabolic depletion, although cell surface Na(+),K(+)-ATPase levels remain unaffected by ATP depletion. Treatment with the AMP-activated kinase agonist, AICAR, increases V(max) for net 3-O-methylglucose uptake by 2-fold. Glucose depletion and treatment with potassium cyanide, carbonyl cyanide p-trifluoromethoxyphenylhydrazone, and AICAR also increase AMP-dependent kinase phosphorylation in bEnd.3 cells. These results suggest that metabolic stress rapidly stimulates blood-brain barrier endothelial cell sugar transport by acute up-regulation of plasma membrane GLUT1 levels, possibly involving AMP-activated kinase activity.


Figures
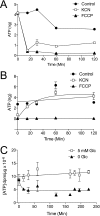
FIGURE 1.
FIGURE 1.
ATP depletion in bEnd.3 cells. A, time course of ATP depletion of bEnd.3 cells incubated with PBS containing 5 mm glucose (●), 5 mm glucose + 5 mm KCN (□), or 5 mm glucose + 8 μg/ml FCCP (▴). Ordinate, ATP levels in nanograms per 100 μl of cell extract. Abscissa, time of cellular exposure to poison in minutes. Data points represent the mean ± S.E. for three ATP assays. B, time course of ATP recovery following poisoning. Cells were treated with PBS containing 5 mm glucose (●), 5 mm glucose + 5 mm KCN (□), or 5 mm glucose + 8 μg/ml FCCP (▴) for 10 min and then restored to normal growth media (PBS plus 5 mm glucose) for the times indicated. Ordinate, ATP levels in nanograms per 100 μl of extract. Abscissa, time (minutes) that cells were allowed to recover from initial poisoning. Data points represent the mean ± S.E. for three separate ATP assays. C, time course of glucose depletion-induced ATP-depletion in bEnd.3 cells. Cells were treated with PBS containing 5 mm glucose (□) or 0 glucose (▴) for 0–230 min at 37 °C. Ordinate, ATP levels in dpm/μg total lysate protein. Abscissa, time (minutes) that cells were exposed to 0 or 5 mm glucose. Data points represent the mean ± S.E. for three separate ATP assays.
FIGURE 2.
FIGURE 2.
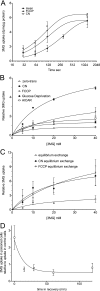
Sugar uptake at 4 °C in bEnd.3 cells. A, time course of 20 mm 3-OMG uptake in control cells (●) or in cells exposed to 5 mm KCN (□) or to 8 μg/ml FCCP (▴) for 15 min at 37 °C prior to cooling, glucose depletion, and transport initiation. Ordinate, 3-OMG uptake (dpm per μg total cell protein); abscissa, time in seconds (note the log2 scale). Data points represent the mean ± S.E. of three separate determinations. The curves drawn through the points were computed by nonlinear regression assuming monoexponential 3-OMG uptake and have the following constants: control, equilibrium space = 5.65 ± 0.38 dpm/μg; k = 0.0032 ± 0.0005/s. For FCCP, equilibrium space = 5.60 ± 0.53 dpm/μg, k = 0.0073 ± 0.0017/s. For KCN, equilibrium space = 6.43 ± 0.58 dpm/μg, k = 0.0089 ± 0.0019/s. B, concentration dependence of zero-trans 3-OMG uptake in control cells (○), cells exposed to 5 mm KCN (■), 8 μg/ml FCCP (▿), 0 glucose (●), or to 2 mm AICAR (□) for 15 min at 37 °C. Ordinate, relative rate of unidirectional 3-OMG uptake; abscissa, [3-OMG] in millimolar. Prior to 30-s measurements of uptake, cells were cooled to 4 °C and incubated in 0-glucose medium for 15 min (sufficient time for intracellular glucose to become depleted through export). The curves were computed by nonlinear regression assuming that uptake is described by the Michaelis-Menten equation (Equation 1), and the resulting Vmax and Km(app) values are summarized in Table 1. Each point represents the mean ± S.E. of three to eight separate experiments. C, equilibrium exchange transport. Cells were pre-loaded with increasing amounts of 3-OMG (from 5 to 40 mm) and allowed to equilibrate before treating for 10 min with control medium (○), 5 mm KCN (■), or 8 μg/ml FCCP (▿) each containing the preloading [3-OMG] at 37 °C. The cells were cooled, and unidirectional 3-OMG uptake was measured at 4 °C. Ordinate and abscissa are same as in B. The curves were computed by nonlinear regression assuming transport is described by Equation 1, and the resulting Vmax and Km(app) values are summarized in Table 1. Each point represents the mean ± S.E. for three separate experiments. D, time course of recovery of KCN stimulation of transport upon washout of KCN. Cells were treated with 5 mm KCN for 15 min at 37 °C. The medium was then replaced with KCN-free medium containing glucose for the times shown on the abscissa. The cells were cooled to 4 °C and incubated in 0-glucose medium for 15 min (sufficient time or intracellular glucose to become depleted through export), and zero-trans 3-OMG uptake was measured at 20 mm 3-OMG. The curve drawn through the points was calculated by nonlinear regression assuming a monoexponential decay in transport rates. Transport falls 4-fold with a half-time of 9 min. Each point represents the mean ± S.E. of three separate experiments.
FIGURE 3.
FIGURE 3.
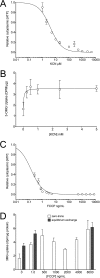
Concentration dependence of ATP depletion (A) and transport stimulation (B) by KCN or concentration dependence of ATP depletion (C) and transport stimulation (D) by FCCP. Cells were exposed to varying [poison] for 10 min at 37 °C and then cooled, and cellular ATP content was measured as described previously. A and C, ordinates, relative to cytoplasmic [ATP] (luminescence per unit of cell protein); A and C, abscissas, [poison]. B and D, ordinates, 3-OMG uptake in dpm/μg protein; B and D, abscissas, [poison]. Each experiment was repeated at least three times, and results are shown as mean ± S.E. Curves in A and C were computed assuming that [ATP] decreases in a saturable manner with [poison]. K0.5 for [ATP] depletion by KCN <3.9 ± 0.6 μm and by FCCP is 0.14 ± 0.01 ng/ml. The curve in B was computed by nonlinear regression assuming that sugar uptake increases in a saturable manner with [poison]. K0.5 for transport stimulation by KCN is 0.04 ± 0.03 mm. D, FCCP stimulation of zero-trans (open bars) and equilibrium exchange (shaded bars) transport are shown.
FIGURE 4.
FIGURE 4.
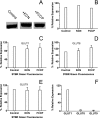
RT-PCR of bEnd.3 cells. A, end point reverse transcriptase-PCR of bEnd.3 cells using a GLUT1 primer. Cells were incubated for 10 min in either PBS, PBS + 5 mm KCN, or PBS + 8 μg/ml FCCP before isolating total RNA, and reverse transcriptase-PCR was carried out using a GLUT1 primer. Samples were run on a 1.5% agarose gel. B, quantitation of GLUT1 band densities from end point RT-PCR. Ordinate, relative expression (%). Experimental conditions (control PBS, PBS + KCN, and PBS + FCCP) are shown below the abscissa. C–F, quantitative RT-PCR of bEnd.3 cells. Ordinate and abscissa are as in B. Cells were processed as in A and 100 ng of total RNA was used for each reaction, which was run twice with four replicates for each condition. Results are shown as mean ± S.E. Primers specific to GLUT1 (C), GLUT8 (D), and GLUT9 (E) were used in each reaction. F, in this chart, the amount of GLUT8 and GLUT9 message in control cells is expressed relative to GLUT1 message in control cells.
FIGURE 5.
FIGURE 5.
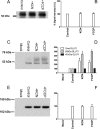
Biotinylation of bEnd.3 cell surface proteins. A, representative Western blot of whole cell lysates of bEnd.3 cells in the absence or presence of either 5 mm KCN or 8 μg/ml of FCCP for 10 min. Total protein (20 μg) was loaded into each lane and probed with GLUT1 C-terminal antibody. B, quantitation of Western blot band density. Ordinate, relative expression (%); abscissa, experimental condition −PBS, PBS + KCN, and PBS + FCCP. C and E, representative Western blots of cell surface biotinylated bEnd.3 cell proteins obtained in the absence and presence of either 5 mm KCN or 8 μg/ml FCCP. Cells were poisoned at 37 °C for 10 min before cooling to 4 °C and biotinylation. 30 μg of total streptavidin-pulldown protein was loaded onto each gel and blotted with either GLUT1 C-terminal antibody (C) or antibody raised against Na+,K+-ATPase (E). Band densities were quantitated and shown in D (GLUT1) and F (Na+,K+-ATPase). Ordinate and abscissa are as in B. D, results are shown for total C-terminal antibody-reactive species (open bars), for 55-kDa C-terminal antibody-reactive species (gray bars), and for 48-kDa C-terminal antibody-reactive species (black bars). Each experiment was repeated at least three times, and the results of quantitations (B, D, and F) are shown as mean ± S.E.
FIGURE 6.
FIGURE 6.
Immunoblot analysis of bEnd.3 cell AMPK and phosphorylated AMPK content. A and B, whole cell lysates (20 μg of protein) were resolved by SDS-PAGE and immunoblotted using AMPK (A) and phosphorylated AMPK (B)-directed antibodies. Prior to lysis, cells were treated for 15 min at 37 °C with 5 m glucose (control), 0 glucose, 5 mm KCN, 8 μg/ml FCCP, or 2 mm AICAR. The mobilities of 76- and 52-kDa molecular mass standards are indicated. C, quantitation of band densities. Ordinate, ratio of immunoreactive phosphorylated AMPK to AMPK in extracts. Abscissa, experimental conditions (control PBS, 0 glucose, PBS + KCN, PBS + FCCP, and PBS + AICAR). Results are shown as mean ± S.E. of three separate experiments.

Similar articles

Cited by

References

    1. Flier J. S., Mueckler M., McCall A. L., Lodish H. F. (1987) J. Clin. Invest. 79, 657–661 - PMC - PubMed
    1. Gerhart D. Z., LeVasseur R. J., Broderius M. A., Drewes L. R. (1989) J. Neurosci. Res. 22, 464–472 - PubMed
    1. Kalaria R. N., Gravina S. A., Schmidley J. W., Perry G., Harik S. I. (1988) Ann. Neurol. 24, 757–764 - PubMed
    1. Pardridge W. M., Boado R. J., Farrell C. R. (1990) J. Biol. Chem. 265, 18035–18040 - PubMed
    1. Takata K., Kasahara T., Kasahara M., Ezaki O., Hirano H. (1990) Biochem. Biophys. Res. Commun. 173, 67–73 - PubMed

Publication types

LinkOut - more resources