. 2010 May 7;285(19):14495-503.
doi: 10.1074/jbc.M110.116525. Epub 2010 Mar 15.

DNase I hypersensitivity and epsilon-globin transcriptional enhancement are separable in locus control region (LCR) HS1 mutant human beta-globin YAC transgenic mice

Affiliations

DNase I hypersensitivity and epsilon-globin transcriptional enhancement are separable in locus control region (LCR) HS1 mutant human beta-globin YAC transgenic mice

Motoshi Shimotsuma et al. J Biol Chem. .

Abstract

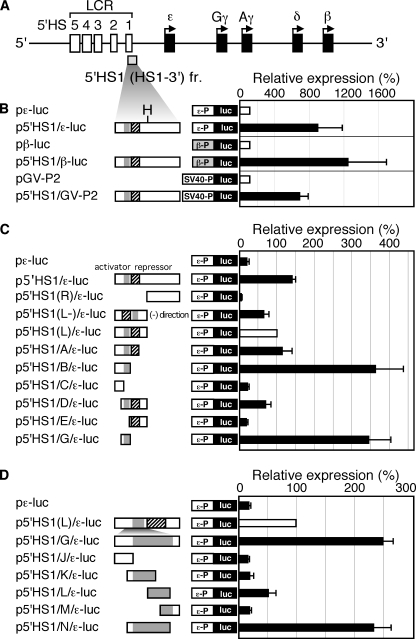
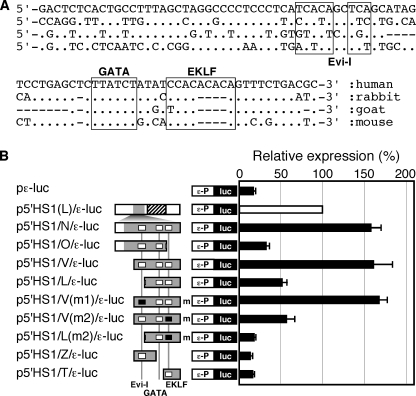
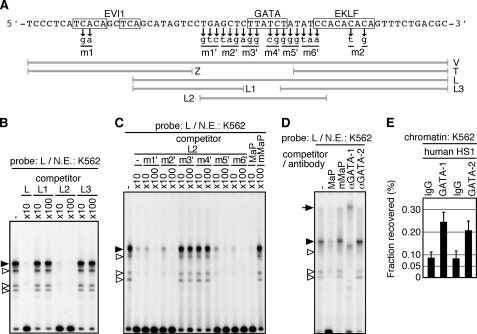
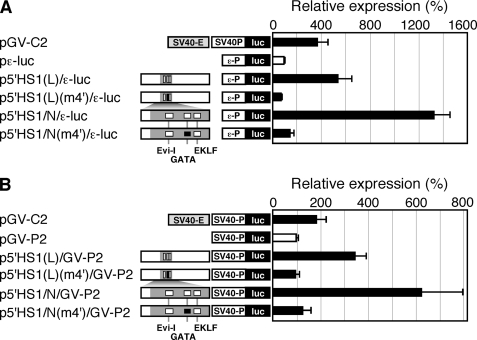
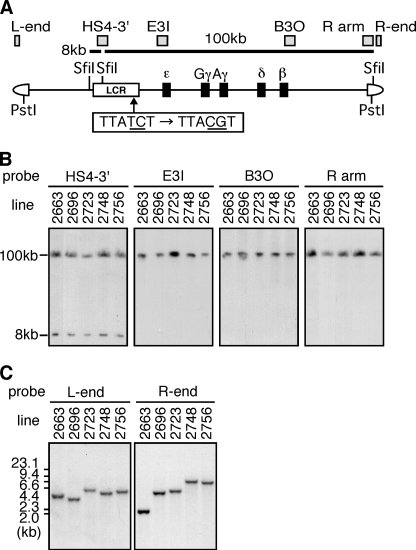
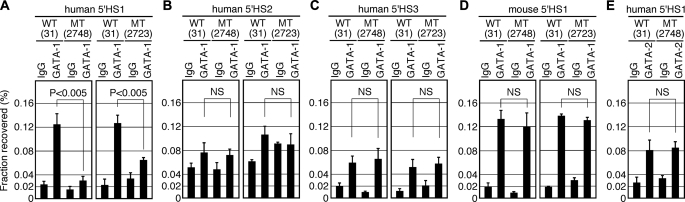
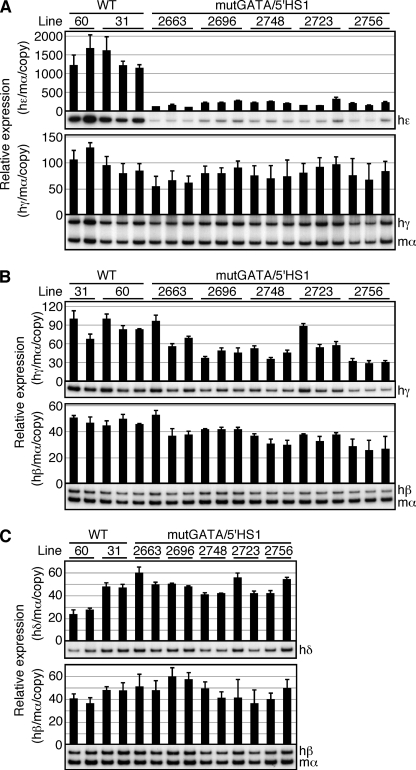
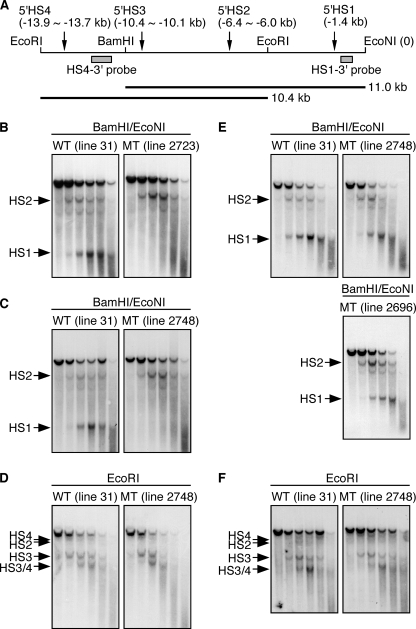
Expression of the five beta-like globin genes (epsilon, Ggamma, Agamma, delta, beta) in the human beta-globin locus depends on enhancement by the locus control region, which consists of five DNase I hypersensitive sites (5'HS1 through 5'HS5). We report here a novel enhancer activity in 5'HS1 that appears to be potent in transfected K562 cells. Deletion analyses identified a core activating element that bound to GATA-1, and a two-nucleotide mutation that disrupted GATA-1 binding in vitro abrogated 5'HS1 enhancer activity in transfection experiments. To determine the in vivo role of this GATA site, we generated multiple lines of human beta-globin YAC transgenic mice bearing the same two-nucleotide mutation. In the mutant mice, epsilon-, but not gamma-globin, gene expression in primitive erythroid cells was severely attenuated, while adult beta-globin gene expression in definitive erythroid cells was unaffected. Interestingly, DNaseI hypersensitivity near the 5'HS1 mutant sequence was eliminated in definitive erythroid cells, whereas it was only mildly affected in primitive erythroid cells. We therefore conclude that, although the GATA site in 5'HS1 is critical for efficient epsilon-globin gene expression, hypersensitive site formation per se is independent of 5'HS1 function, if any, in definitive erythroid cells.


Figures

FIGURE 1.
FIGURE 1.
Identification of core sequences of the 5′HS1 enhancer. A, structure of the human β-globin locus. The 5′HS1 region (formerly termed HS1–3′, (24) is located from −6189 to −5248 nucleotides upstream of the ϵ-globin transcription start site. H: HindIII site. B–D, 5′HS1 fragment and its deletion mutants were linked to the luciferase (luc) reporter gene under the control of the ϵ-globin (ϵ-P; −174 to +38, relative to transcription start site), β-globin (β-P), or SV40 (SV40-P) promoters. These reporter constructs, as well as the control plasmid CMV-β-gal, were cotransfected into K562 cells. Luciferase activities were normalized to β-Gal activities to control for transfection efficiencies. The luciferase activities are expressed relative to those (open bars, set at 100) in the constructs without a linked enhancer fragment in B or in the p5′HS1(L)/ϵ-luc in C and D. Each value represents the mean ± S.D. for at least three independent experiments. Gray and hatched boxes represent putative enhancer and repressor sequences, respectively.
FIGURE 2.
FIGURE 2.
Identification of transcription factor binding sites in the 5′HS1 enhancer. A, cross-species comparison between the “N” enhancer fragment sequences. Putative transcription factor binding motifs found in the human sequences are boxed. (.) : identical nucleotides; (−): missing nucleotides. B, deletions and/or point mutations (shown in Fig. 3A) were introduced into the HS1/N fragment to systematically disrupt putative transcription factor binding motifs; their effects on enhancer activity were tested in K562 cells as described in the legend to Fig. 1, C and D. Open boxes, intact Evi-I, GATA, and EKLF motifs shown in A. Solid boxes (m), mutated factor binding motifs.
FIGURE 3.
FIGURE 3.
In vitro and in vivo binding of GATA-1 to the 5′HS1 enhancer core sequences. A, sequence of the enhancer core element and portions of probe or competitor DNA fragments used in the EMSA (gray thick lines). Two- or three-base pair substitutions (m1, m2, and m1′–m6′) were introduced to mutate the factor binding motifs (boxed). B–D, EMSA. K562 nuclear extract was incubated with unlabeled 10- or 100-fold molar excess of competitor DNA fragments or specific antibodies, followed by the addition of radiolabeled L fragment probe; complex formation was analyzed by neutral polyacrylamide gel electrophoresis. Shifted bands are indicated by solid (strong binding) or open triangles. Mouse α-globin promoter sequences containing intact (MaP) or mutated (mMaP) GATA motifs were also included as competitors. E, GATA-1 and GATA-2 ChIP of the human 5′HS1 in K562 cells. Chromatin was immunoprecipitated with anti-GATA-1, anti-GATA-2 antibodies or control IgG. Immunoprecipitated DNA was quantified by real-time quantitative PCR (qPCR) using specific primers and normalized to input DNA. ChIP was repeated twice for each chromatin, and qPCR was repeated at least three times for each immunoprecipitated DNA. Data represent the averages with S.D.
FIGURE 4.
FIGURE 4.
The GATA motif is responsible for the majority of 5′HS1 enhancer activity. The 2-bp GATA site mutation (m4′ in Fig. 3A) was introduced into the N, and 5′HS1(L) fragments. Wild-type and mutant enhancer fragments were linked to the ϵ-globin (A) or the SV40 (B) promoters, and their transcriptional activities were tested in K562 cells. Luciferase activities are expressed relative to those in the pϵ-luc or pGV-P2 (set at 100) in A and B, respectively. Solid box: mutated GATA motif.
FIGURE 5.
FIGURE 5.
Generation and structural analysis of mutGATA/5′HS1 TgM. A, structure of the 150-kb human β-globin YAC. The positions of the β-like globin genes (solid rectangles) are shown relative to the LCR. SfiI restriction enzyme sites are located 5′ to 5′HS5, between 5′HS4 and 5′HS3, and in the right arm of the YAC. Probes (gray rectangles) used for long-range (B) and end fragment (C) analyses, and expected restriction enzyme fragments with their sizes are shown. The GATA motif within the 5′HS1 region was mutated by substituting two nucleotides (underlined in the box) in the YAC. B, long-range structural analyses of the human β-globin YAC in TgM. The whole β-globin locus is contained within two SfiI fragments (8 and 100 kb, as above). DNAs from thymus cells were digested with SfiI in agarose plugs, separated by pulsed-field gel electrophoresis, and hybridized separately to the probes shown in A. C, tail DNA was digested with PstI, fractionated on agarose gels, and hybridized to L-end and R-end probes (shown in A).
FIGURE 6.
FIGURE 6.
In vivo analysis of GATA factor recruitment to the LCR-5′HSs. 1–2-month-old animals carrying either WT or mutant (MT) YAC transgenes were made anemic by phenylhydrazine treatment, and spleens were collected. Chromatin was subjected to ChIP reactions using antibodies against GATA-1, GATA-2, or control IgG. Immunoprecipitated DNA was quantified by real-time qPCR using specific primers recognizing the human (A–C and E) or mouse (D) HS sites, and normalized to input DNA. Sequences of primers are listed in supplemental Table S4. ChIP was repeated twice for each chromatin and qPCR was repeated at least three times for each immunoprecipitated DNA. Data represent the averages with S.D. TgM lines are shown in parentheses. NS, not significant.
FIGURE 7.
FIGURE 7.
Expression of the human β-like globin genes in the TgM. A, total RNA was prepared from the yolk sacs of more than two embryos (9.5 dpc) derived from the intercross of male transgenic and female non-Tg animals. Expression of human ϵ (hϵ)- and human γ (hγ)-globin compared with endogenous mouse α (mα)-globin genes was separately analyzed by semi-quantitative RT-PCR. The signals for hϵ-globin at 18 cycles and hγ/mα-globin at 12 cycles were quantified by phosphorimager, and the ratios of hϵ/mα (top) and hγ/mα (bottom) were calculated (the mα signal at 12 cycles was set at 100%). B, total RNA was prepared from the fetal livers of more than two fetuses (14.5 dpc). Expression of hγ- and human β (hβ)-globin compared with endogenous mα-globin genes was analyzed. The signals for hγ-globin at 18 cycles and hβ/mα-globin at 12 cycles were quantified, and the ratios of hγ/mα (top) and hβ/mα (bottom) were calculated (the mα signal at 12 cycles was set at 100%). C, total RNA was prepared from the anemic spleens of 1-month-old mice. Samples were collected from two individuals from each line of TgM. Expression of human δ (hδ) and hβ-globin compared with endogenous mα-globin genes was analyzed. The signals for hδ-globin at 16 cycles and hβ/mα-globin at 12 cycles were quantified, and the ratio of hδ/mα (top) and hβ/mα (bottom) were calculated (the mα signal at 12 cycles was set at 100%). The average ± S.D. from at least three independent experiments was calculated and graphically depicted. Representative results are shown below each panel.
FIGURE 8.
FIGURE 8.
DNaseI hypersensitive site mapping of the human LCR chromatin in wild-type and mutant YAC transgenic mice. A, schematic representation of the human LCR. Fragments generated by digestion with BamHI/EcoNI (11.0 kb) or EcoRI (10.4 kb) are shown as horizontal thick lines. The location of the core elements of 5′HS1 (located at −1.4 kb relative to the EcoNI site at the 3′-end of the fragment), 5′HS2 (between −6.4 and −6.0 kb), 5′HS3 (−10.4 and −10.1 kb), and 5′HS4 (−13.9 and −13.7 kb) and the probes used for detecting the fragments (HS4–3′ and HS1–3′) are indicated by vertical arrows or gray boxes, respectively. Nuclei were isolated from blood cells of anemic spleens (B–D) or 10.5 dpc embryos (E and F) of TgM (line numbers in parentheses) carrying either WT or mutant (MT) human β-globin YACs, and treated with increasing concentrations of DNaseI. DNA was then isolated and digested with BamHI/EcoNI (B, C, and E) or EcoRI (D and F). After agarose gel electrophoresis, the DNA was transferred to nylon membranes and hybridized to either HS1–3′ (B, C, and E) or HS4–3′ (D) probes. The positions of the HS sites formed are indicated by arrows.

Similar articles

Cited by

References

    1. Stamatoyannopoulos G., Neinhuis A. W. (1994) in The Molecular Basis of Blood Diseases (Stamatoyannopoulos G., Neinhuis A. W., Majerus P., Varmus H. ed), pp. 107–155, 2 Ed., W. B. Saunders Co., New York
    1. Forrester W. C., Thompson C., Elder J. T., Groudine M. (1986) Proc. Natl. Acad. Sci. U.S.A. 83, 1359–1363 - PMC - PubMed
    1. Grosveld F., Greaves D., Philipsen S., Talbot D., Pruzina S., deBoer E., Hanscombe O., Belhumeur P., Hurst J., Fraser P., et al. (1990) Ann. N.Y. Acad. Sci. 612, 152–159 - PubMed
    1. Tuan D., London I. M. (1984) Proc. Natl. Acad. Sci. U.S.A. 81, 2718–2722 - PMC - PubMed
    1. Strouboulis J., Dillon N., Grosveld F. (1992) Genes Dev. 6, 1857–1864 - PubMed

Publication types

MeSH terms