Genetic sensitivity to the environment: the case of the serotonin transporter gene and its implications for studying complex diseases and traits
- PMID: 20231323
- PMCID: PMC2943341
- DOI: 10.1176/appi.ajp.2010.09101452
Genetic sensitivity to the environment: the case of the serotonin transporter gene and its implications for studying complex diseases and traits
Abstract
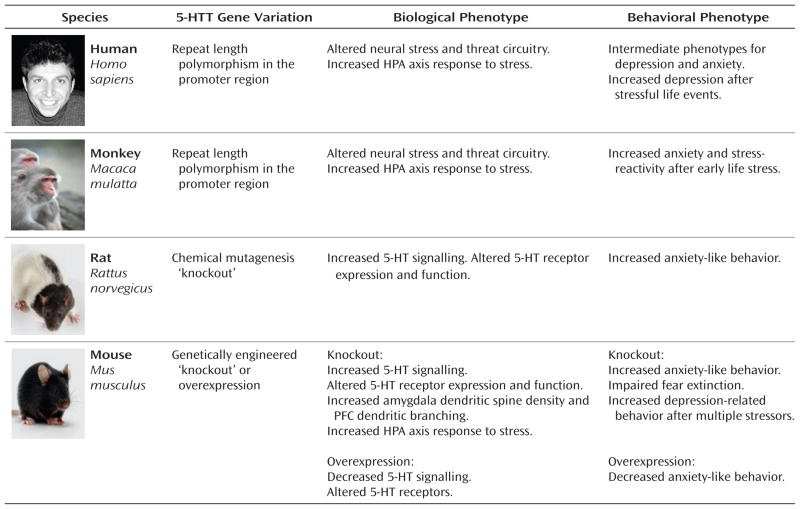
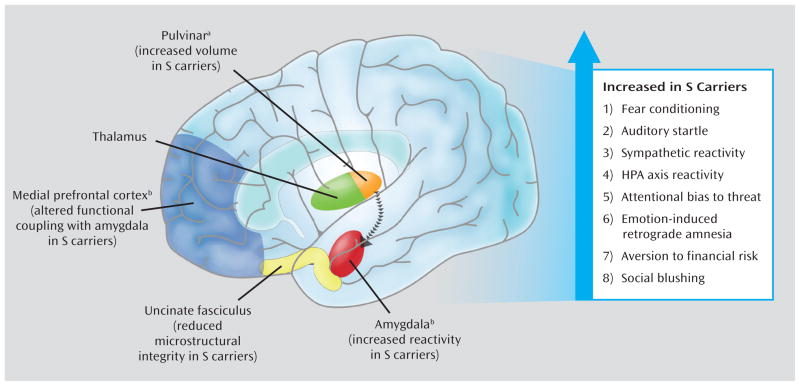
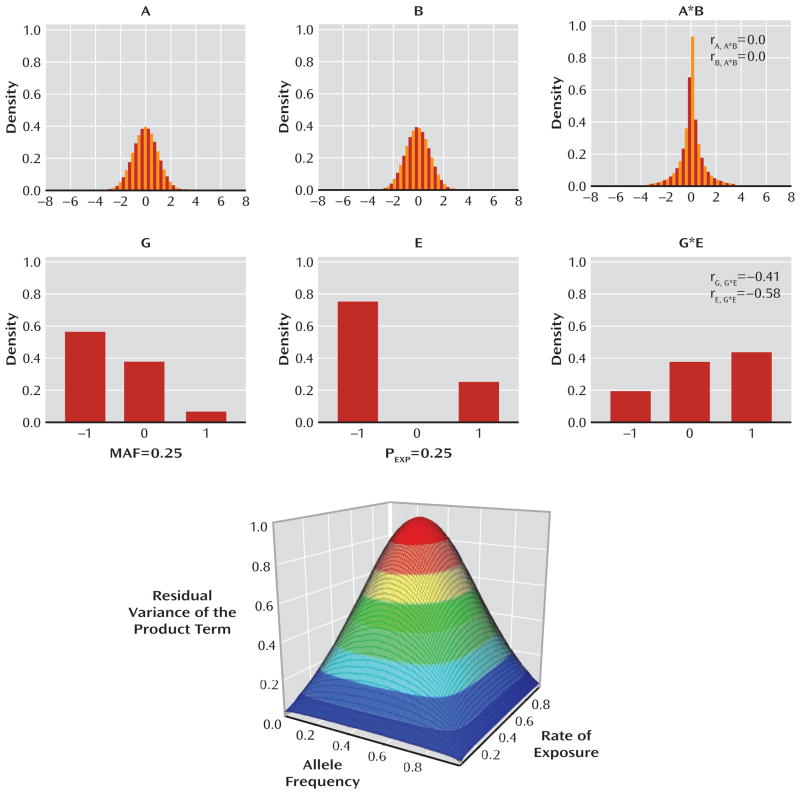
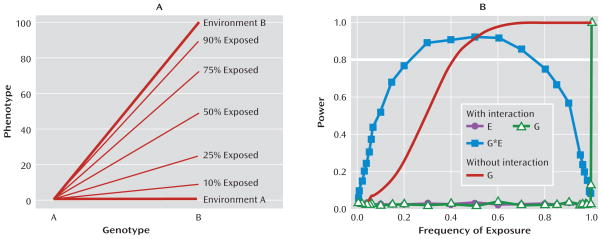
Evidence of marked variability in response among people exposed to the same environmental risk implies that individual differences in genetic susceptibility might be at work. The study of such Gene-by-Environment (GxE) interactions has gained momentum. In this article, the authors review research about one of the most extensive areas of inquiry: variation in the promoter region of the serotonin transporter gene (SLC6A4; also known as 5-HTT) and its contribution to stress sensitivity. Research in this area has both advanced basic science and generated broader lessons for studying complex diseases and traits. The authors evaluate four lines of evidence about the 5-HTT stress-sensitivity hypothesis: 1) observational studies about the serotonin transporter linked polymorphic region (5-HTTLPR), stress sensitivity, and depression in humans; 2) experimental neuroscience studies about the 5-HTTLPR and biological phenotypes relevant to the human stress response; 3) studies of 5-HTT variation and stress sensitivity in nonhuman primates; and 4) studies of stress sensitivity and genetically engineered 5-HTT mutations in rodents. The authors then dispel some misconceptions and offer recommendations for GxE research. The authors discuss how GxE interaction hypotheses can be tested with large and small samples, how GxE research can be carried out before as well as after replicated gene discovery, the uses of GxE research as a tool for gene discovery, the importance of construct validation in evaluating GxE research, and the contribution of GxE research to the public understanding of genetic science.
Figures
Similar articles
-
Current developments and controversies: does the serotonin transporter gene-linked polymorphic region (5-HTTLPR) modulate the association between stress and depression?Curr Opin Psychiatry. 2010 Nov;23(6):582-7. doi: 10.1097/YCO.0b013e32833f0e3a. Curr Opin Psychiatry. 2010. PMID: 20881788 Review.
-
Interaction of chronic stress with serotonin transporter and catechol-O-methyltransferase polymorphisms in predicting youth depression.Depress Anxiety. 2010 Aug;27(8):737-45. doi: 10.1002/da.20715. Depress Anxiety. 2010. PMID: 20577990 Free PMC article.
-
Epigenetic regulation of serotonin transporter expression and behavior in infant rhesus macaques.Genes Brain Behav. 2010 Aug;9(6):575-82. doi: 10.1111/j.1601-183X.2010.00588.x. Epub 2010 Apr 12. Genes Brain Behav. 2010. PMID: 20398062 Free PMC article.
-
Interaction of the serotonin transporter-linked polymorphic region and environmental adversity: increased amygdala-hypothalamus connectivity as a potential mechanism linking neural and endocrine hyperreactivity.Biol Psychiatry. 2012 Jul 1;72(1):49-56. doi: 10.1016/j.biopsych.2012.01.030. Epub 2012 Mar 13. Biol Psychiatry. 2012. PMID: 22418015
-
The serotonin transporter gene and functional and pathological adaptation to environmental variation across the life span.Prog Neurobiol. 2012 Nov;99(2):117-27. doi: 10.1016/j.pneurobio.2012.08.003. Epub 2012 Aug 28. Prog Neurobiol. 2012. PMID: 22954594 Review.
Cited by
-
Neonatal Tactile Stimulation Alters Behaviors in Heterozygous Serotonin Transporter Male Rats: Role of the Amygdala.Front Behav Neurosci. 2020 Aug 12;14:142. doi: 10.3389/fnbeh.2020.00142. eCollection 2020. Front Behav Neurosci. 2020. PMID: 32903627 Free PMC article.
-
The First Pilot Genome-Wide Gene-Environment Study of Depression in the Japanese Population.PLoS One. 2016 Aug 16;11(8):e0160823. doi: 10.1371/journal.pone.0160823. eCollection 2016. PLoS One. 2016. PMID: 27529621 Free PMC article.
-
Serotonin-1A receptor polymorphism (rs6295) associated with thermal pain perception.PLoS One. 2012;7(8):e43221. doi: 10.1371/journal.pone.0043221. Epub 2012 Aug 31. PLoS One. 2012. PMID: 22952650 Free PMC article.
-
Dysfunctional Attitudes and Affective Responses to Daily Stressors: Separating Cognitive, Genetic, and Clinical Influences on Stress Reactivity.Cognit Ther Res. 2015 Jun;39(3):366-377. doi: 10.1007/s10608-014-9657-1. Epub 2014 Dec 31. Cognit Ther Res. 2015. PMID: 27041782 Free PMC article.
-
Financial difficulties but not other types of recent negative life events show strong interactions with 5-HTTLPR genotype in the development of depressive symptoms.Transl Psychiatry. 2016 May 3;6(5):e798. doi: 10.1038/tp.2016.57. Transl Psychiatry. 2016. PMID: 27138797 Free PMC article.
References
-
- Lesch KP, Bengel D, Heils A, Sabol SZ, Greenberg BD, Petri S, Benjamin J, Muller CR, Hamer DH, Murphy DL. Association of anxiety-related traits with a polymorphism in the serotonin transporter gene regulatory region. Science. 1996;274:1527–1531. - PubMed
-
- Hariri AR, Mattay VS, Tessitore A, Kolachana B, Fera F, Goldman D, Egan MF, Weinberger DR. Serotonin transporter genetic variation and the response of the human amygdala. Science. 2002;297:400–404. - PubMed
-
- Caspi A, Sugden K, Moffitt TE, Taylor A, Craig IW, Harrington H, McClay J, Mill J, Martin J, Braithwaite A, Poulton R. Influence of life stress on depression: moderation by a polymorphism in the 5-HTT gene. Science. 2003;301:386–389. - PubMed
-
- Caspi A, Moffitt TE. Gene-environment interactions in psychiatry: joining forces with neuroscience. Nat Rev Neurosci. 2006;7:583–590. - PubMed
-
- van Os J, Rutten BP. Gene-environment-wide interaction studies in psychiatry. Am J Psychiatry. 2009;166:964–966. - PubMed
Publication types
MeSH terms
Substances
Grants and funding
- AG032282/AG/NIA NIH HHS/United States
- G9806489/MRC_/Medical Research Council/United Kingdom
- G0601483/MRC_/Medical Research Council/United Kingdom
- MH077874/MH/NIMH NIH HHS/United States
- ZIA AA000411/ImNIH/Intramural NIH HHS/United States
- R01 MH077874/MH/NIMH NIH HHS/United States
- MH072837/MH/NIMH NIH HHS/United States
- K01 MH072837/MH/NIMH NIH HHS/United States
- HD061298/HD/NICHD NIH HHS/United States
- G0100527/MRC_/Medical Research Council/United Kingdom
- R01 HD061298/HD/NICHD NIH HHS/United States
- R01 AG032282/AG/NIA NIH HHS/United States
LinkOut - more resources
Full Text Sources
Medical