

Gene network visualization and quantitative synteny analysis of more than 300 marine T4-like phage scaffolds from the GOS metagenome
- PMID: 20231334
- PMCID: PMC2908710
- DOI: 10.1093/molbev/msq076
Gene network visualization and quantitative synteny analysis of more than 300 marine T4-like phage scaffolds from the GOS metagenome
Abstract
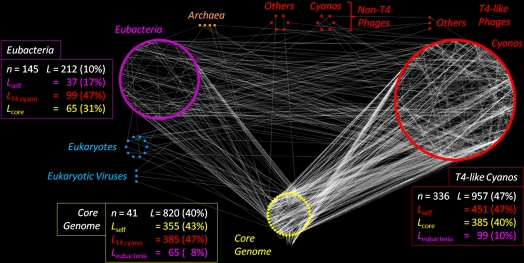
Bacteriophages (phages) are the most abundant biological entities in the biosphere and are the dominant "organisms" in marine environments, exerting an enormous influence on marine microbial populations. Metagenomic projects, such as the Global Ocean Sampling expedition (GOS), have demonstrated the predominance of tailed phages (Caudovirales), particularly T4 superfamily cyanophages (Cyano-T4s), in the marine milieu. Whereas previous metagenomic analyses were limited to gene content information, here we present a comparative analysis of over 300 phage scaffolds assembled from the viral fraction of the GOS data. This assembly permits the examination of synteny (organization) of the genes on the scaffolds and their comparison with the genome sequences from cultured Cyano-T4s. We employ comparative genomics and a novel usage of network visualization software to show that the scaffold phylogenies are similar to those of the traditional marker genes they contain. Importantly, these uncultured metagenomic scaffolds quite closely match the organization of the "core genome" of the known Cyano-T4s. This indicates that the current view of genome architecture in the Cyano-T4s is not seriously biased by being based on a small number of cultured phages, and we can be confident that they accurately reflect the diverse population of such viruses in marine surface waters.
Figures
Similar articles
-
The capsid of the T4 phage superfamily: the evolution, diversity, and structure of some of the most prevalent proteins in the biosphere.Mol Biol Evol. 2008 Jul;25(7):1321-32. doi: 10.1093/molbev/msn080. Epub 2008 Apr 7. Mol Biol Evol. 2008. PMID: 18391067
-
Modular architecture of the T4 phage superfamily: a conserved core genome and a plastic periphery.Virology. 2007 Jun 5;362(2):384-96. doi: 10.1016/j.virol.2006.12.031. Epub 2007 Feb 7. Virology. 2007. PMID: 17289101
-
Marine phage genomics: the tip of the iceberg.FEMS Microbiol Lett. 2016 Aug;363(15):fnw158. doi: 10.1093/femsle/fnw158. Epub 2016 Jun 22. FEMS Microbiol Lett. 2016. PMID: 27338950 Free PMC article. Review.
-
Genomic analysis of oceanic cyanobacterial myoviruses compared with T4-like myoviruses from diverse hosts and environments.Environ Microbiol. 2010 Nov;12(11):3035-56. doi: 10.1111/j.1462-2920.2010.02280.x. Environ Microbiol. 2010. PMID: 20662890 Free PMC article.
-
Marine phage genomics: what have we learned?Curr Opin Biotechnol. 2005 Jun;16(3):299-307. doi: 10.1016/j.copbio.2005.03.007. Curr Opin Biotechnol. 2005. PMID: 15961031 Review.
Cited by
-
Campylobacter jejuni group III phage CP81 contains many T4-like genes without belonging to the T4-type phage group: implications for the evolution of T4 phages.J Virol. 2011 Sep;85(17):8597-605. doi: 10.1128/JVI.00395-11. Epub 2011 Jun 22. J Virol. 2011. PMID: 21697478 Free PMC article.
-
An ORFan no more: the bacteriophage T4 39.2 gene product, NwgI, modulates GroEL chaperone function.Genetics. 2012 Mar;190(3):989-1000. doi: 10.1534/genetics.111.135640. Epub 2012 Jan 10. Genetics. 2012. PMID: 22234860 Free PMC article.
-
The episodic evolution of fibritin: traces of ancient global environmental alterations may remain in the genomes of T4-like phages.Ecol Evol. 2013 Sep;3(10):3628-35. doi: 10.1002/ece3.730. Epub 2013 Sep 1. Ecol Evol. 2013. PMID: 24223296 Free PMC article.
-
Phages in nature.Bacteriophage. 2011 Jan;1(1):31-45. doi: 10.4161/bact.1.1.14942. Bacteriophage. 2011. PMID: 21687533 Free PMC article.
-
Role of Phylogenetic Structure in the Dynamics of Coastal Viral Assemblages.Appl Environ Microbiol. 2021 May 11;87(11):e02704-20. doi: 10.1128/AEM.02704-20. Print 2021 May 11. Appl Environ Microbiol. 2021. PMID: 33741635 Free PMC article.
References
-
- Ackermann HW. 5500 Phages examined in the electron microscope. Arch Virol. 2007;152:227–243. - PubMed
Publication types
MeSH terms
Substances
LinkOut - more resources
Full Text Sources
