. 2010 May;30(10):2473-84.
doi: 10.1128/MCB.01093-09. Epub 2010 Mar 15.

Expression of a testis-specific form of Gal3st1 (CST), a gene essential for spermatogenesis, is regulated by the CTCF paralogous gene BORIS

Affiliations

Expression of a testis-specific form of Gal3st1 (CST), a gene essential for spermatogenesis, is regulated by the CTCF paralogous gene BORIS

Teruhiko Suzuki et al. Mol Cell Biol. 2010 May.

Abstract

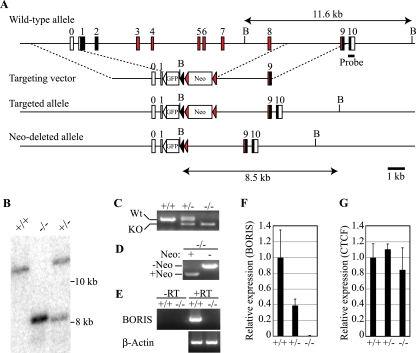
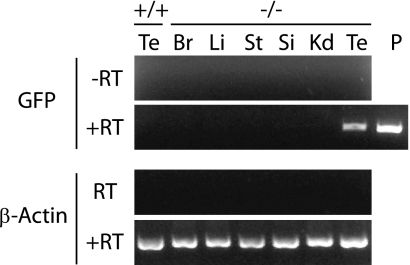
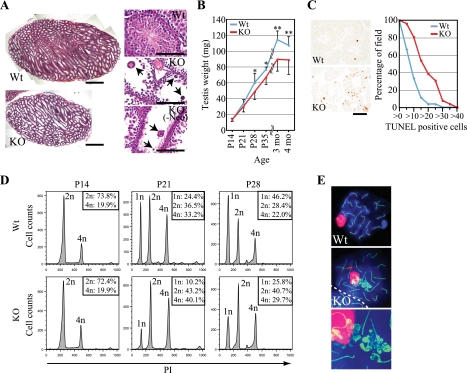
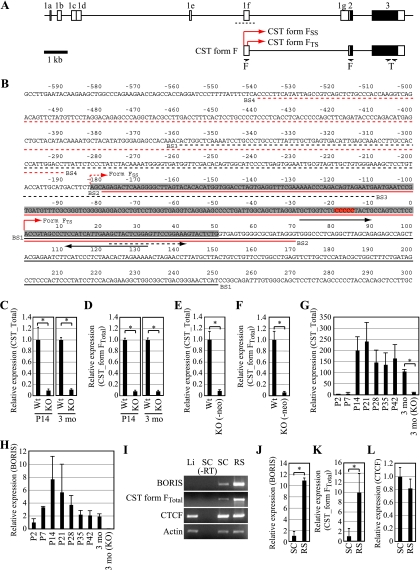
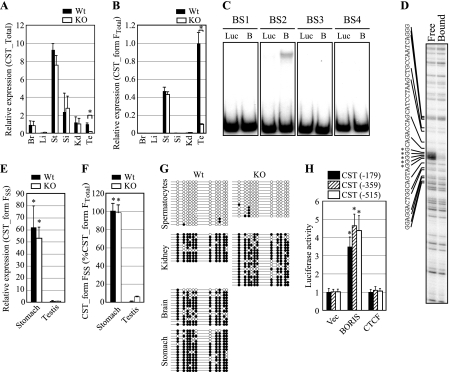
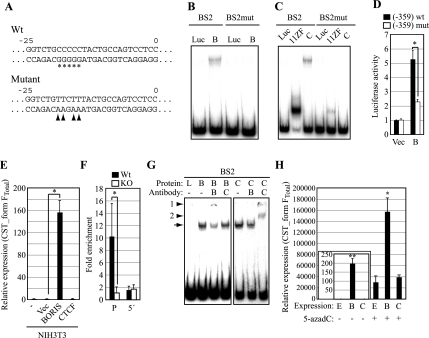
Previously, it was shown that the CTCF paralogous gene, BORIS (brother of the regulator of imprinted sites) is expressed in male germ cells, but its function in spermatogenesis has not been defined. To develop an understanding of the functional activities of BORIS, we generated BORIS knockout (KO) mice. Mice homozygous for the null allele had a defect in spermatogenesis that resulted in small testes associated with increased cell death. The defect was evident as early as postnatal day 21 and was manifested by delayed production of haploid cells. By gene expression profiling, we found that transcript levels for Gal3st1 (also known as cerebroside sulfotransferase [CST]), known to play a crucial role in meiosis, were dramatically reduced in BORIS KO testes. We found that CST is expressed in testis as a novel testis-specific isoform, CST form F(TS), that has a short exon 1f. We showed that BORIS bound to and activated the promoter of CST form F(TS). Mutation of the BORIS binding site in the promoter reduced the ability of BORIS to activate the promoter. These findings define transcriptional regulation of CST expression as a critical role for BORIS in spermatogenesis.


Figures

FIG. 1.
FIG. 1.
(A) Targeting scheme for generation of BORIS (Ctcfl) KO mice. Deletion of the BORIS gene proceeds from the first methionine to exon 8, which includes ZF-1 to -10, and the N-terminal half of ZF-11 is replaced with GFP and a neomycin cassette. The probe used for Southern blotting is indicated. Filled boxes indicate open reading frames; red boxes indicate the coding regions of the 11-ZF domain; open boxes indicate untranslated regions; the open triangle indicates a LoxP site; the filled triangle indicates a Lox511 site. FRT sequences are shown with red triangles. B, BglII. (B) Southern blotting. Genomic DNA was digested with BglII and hybridized with a probe flanking the targeting construct at the 3′ end as diagramed in panel A. (C) Genomic PCR typing of BORIS/ mice. (D) Genomic PCR typing of BORIS/ (-neo) mice. (E) cDNAs prepared from testes of 3-month-old mice were subjected to RT-PCR. (F and G) cDNAs prepared from testes of 3-month-old mice were quantified by qPCR for expression of transcripts for BORIS (F) and CTCF (G) (n = 3). Expression levels are shown as the ratio to wild type.
FIG. 2.
FIG. 2.
Expression of GFP was analyzed by RT-PCR. cDNAs prepared from each tissue are indicated: Te, testis; Br, brain; Li, liver; St, stomach; Si, small intestine; Kd, kidney; P, positive control.
FIG. 3.
FIG. 3.
(A) Hematoxylin and eosin staining of testes prepared from P28 wild-type, BORIS/, and BORIS/ (-neo) mice. Arrows indicate multinucleated cells. Bars, 1 mm (left column); 100 μm (right column). (B) Sizes of wild-type (blue) and BORIS/ (red) testes at various stages. *, P < 0.05; **, P < 0.005. (C) TUNEL staining of testes from P28 wild-type (upper panel) and BORIS/ (lower panel) mice. Bar, 100 μm. TUNEL-positive cells in each field were counted in testes of wild-type (blue) and BORIS/ (red) mice. (D) Representative results of DNA flow cytometry performed on testicular cells prepared from testes of P14, P21, and P28 of wild-type (upper row) and BORIS/ (lower row) mice. The percentage of each population is shown in the inset. At least three mice were analyzed for each analysis. (E) Spermatocytes of wild-type (upper panel) and BORIS/ (middle panel) mice were stained with SCP3 (green), γH2AX (red), and DAPI (blue). A dotted line indicates a boundary of adjacent cells. The lower panel shows a high-magnification image of aberrantly accumulated SCP3 in BORIS/ spermatocytes.
FIG. 4.
FIG. 4.
(A) Genomic structure of the CST gene. Open and filled boxes represent UTRs and open reading frames, respectively. It has been reported that CST has eight splicing variants, all of which have the same coding region with different 5′-UTR sequences (16). CST form FTS is the testis-specific form among splicing variants expressed in other tissues. Arrows denote the positions of primers used to evaluate the expression of CST form FTotal (F) and total CST (T). Red arrows indicate the transcription start site of CST form FSS and CST form FTS. A dotted line indicates sequences shown in panel B. (B) Sequences surrounding exon 1f. The gray box represents the reported exon 1f sequences. The numbering is relative to the transcription start site of CST form FTS, which is marked by a red arrow. The reported transcription start site is marked by a dotted red arrow. The red box shows BORIS/CTCF-contacting residues as determined in a methylation interference assay. Black arrows indicate primers for CST form FSS. The dotted black arrow indicates a forward primer for CST form FTotal. DNA fragments used for EMSA are denoted by solid lines or dotted lines in black or red. (C) cDNAs prepared from wild-type or BORIS/ mouse testis at P14 (n = 3) or at 3 months (n = 3) were subjected to qPCR to evaluate the expression of CST form F. Primers for total CST were used for the experiment. Expression levels are shown as the ratio to wild-type level. Asterisks denote statistical significance (P < 0.005). (D) cDNAs prepared from wild-type or BORIS/ mouse testes at P14 (n = 3) or at 3 months (n = 3) of age were subjected to qPCR to evaluate the expression of CST form F. Primers for CST form FTotal were used for the experiment. Expression levels are shown as the ratio to the wild-type level. Asterisks denote statistical significance (P < 0.005). (E) cDNAs prepared from wild-type or BORIS/ (-neo) mouse testis at P28 were subjected to qPCR to evaluate the expression of CST (n = 3). Primers for total CST were used for the experiment. Expression levels are shown as the ratio to wild type. The asterisk denotes statistical significance (P < 0.005). (F) cDNAs prepared from wild-type or BORIS/ (-neo) mouse testis at P28 were subjected to qPCR to evaluate the expression of CST (n = 3). Primers for CST form FTotal were used for the experiment. Expression levels are shown as the ratio to wild type. The asterisk denotes statistical significance (P < 0.005). (G) cDNAs prepared from wild-type testes were subjected to qPCR analysis to evaluate the expression of CST during testis development. Primers for total CST were used for the experiment (n = 3). Expression levels are shown as the ratio to the P2 testis level. The asterisk denotes statistical significance (P < 0.005). (H) cDNAs prepared from wild-type testes were subjected to qPCR analysis to evaluate the expression of BORIS during testis development (n = 3). Expression levels are shown as the ratio to the P2 testis level. (I) Expression levels of BORIS, CST, and CTCF were analyzed by RT-PCR. cDNAs were prepared from liver (Li), spermatocytes (SC), and round spermatids (RS). (J to L) cDNAs prepared from SC and RS were subjected to qPCR analysis to evaluate the expression levels of BORIS (J), CST (K), and CTCF (L) (n = 3). Expression levels are shown as the ratio to the level in spermatocytes. Asterisks denote statistical significance (P < 0.05).
FIG. 5.
FIG. 5.
(A and B) Expression of CST and CST form F in various tissues of wild-type and BORIS/ mice was analyzed by qPCR (n = 3). Primers for CST form FTotal were used in panel B. Expression levels are shown as the ratio to wild-type testis levels. Asterisks denote statistical significance (P < 0.005). (C) BORIS binding to the promoter region of exon 1f was analyzed by EMSA using fragments shown in Fig. 4B. Luciferase protein was used as a negative control. Luc, luciferase; B, BORIS. (D) Methylation interference assay of the BS2 fragment using 11-ZF. Partial sequences of the fragment are shown. Only the bottom strand is shown, as the top strand did not show any differences. Left lane, unbound fragments; right lane, bound fragments. Asterisks indicate contacting guanine residues. (E) Expression of CST form FSS in stomach and testis of wild-type and BORIS/ mice was analyzed by qPCR (n = 3). Expression levels are shown as the ratio to wild-type testis. Asterisks denote statistical significance versus the testis sample (P < 0.005). (F) The ratio of CST form FSS in CST form FTotal was analyzed by qPCR (n = 3). Due to the massive and specific reduction of CST form FTS expression in BORIS/ testis, the ratio of CST form FSS in CST form FTotal was slightly increased in BORIS/ testis. Asterisks denote statistical significance versus the testis sample (P < 0.01). (G) Methylation status around exon 1f was analyzed by bisulfite sequencing. Open and filled circles represent unmethylated and methylated cytosines, respectively. (H) Activity of the CST form FTS promoter was analyzed by luciferase assay (n = 3). Empty vector (vec), BORIS, or CTCF expression vectors were cotransfected with each construct. Numbers indicate the 5′ end of each construct on the CST form FTS promoter region. Luciferase activities are shown as the ratio to the empty vector-transfected sample. Asterisks denote statistical significance versus empty vector-transfected sample (P < 0.05).
FIG. 6.
FIG. 6.
(A) Sequences of wild-type and mutants of the CST form FTS promoter. Asterisks indicate contacting guanine residues. Four contacting guanines were converted into adenines (arrowheads) in mutant constructs. Numbering shows the positions relative to the transcription start site of CST form FTS. (B) Binding of BORIS to the mutated BS2 fragment was analyzed by EMSA. Luc, luciferase; B, BORIS. (C) Binding of 11-ZF and CTCF to the mutated BS2 fragment was analyzed by EMSA as for panel B. C, CTCF. (D) Luciferase assays were performed using a mutated promoter of the CST form FTS (n = 3). Empty vector or BORIS expression vector were cotransfected with each construct. Luciferase activities are shown as the ratio to empty vector-transfected sample. The asterisk denotes statistical significance (P < 0.05). Vec, empty vector; B, BORIS. (E) Effect of BORIS on CST form FTotal expression was analyzed by transient transfection of a BORIS expression vector into NIH 3T3 cells. Expression of CST form FTotal was analyzed by qPCR (n = 3). Expression levels are shown as the ratio to mock-transfected sample. The asterisk denotes statistical significance versus empty vector-transfected sample (P < 0.005). Vec, empty vector. (F) Binding of BORIS on the CST form FTS promoter (P) and 1.6 kb upstream of the transcription start site (5′) in testis was analyzed in a ChIP-qPCR assay using anti-BORIS antibody (n = 4). The asterisk denotes statistical significance (P < 0.05). (G) Recognition of BORIS/DNA complexes by BORIS antibody was validated by supershift assay. Fragment BS2 was preincubated with BORIS, CTCF, or luciferase followed by incubation with antibody against BORIS or CTCF. The arrow indicates the shifted band. Arrowhead 1 indicates a supershifted band with BORIS antibody, and arrowhead 2 indicates a supershifted band with CTCF antibody. B, BORIS; L, luciferase; C, CTCF. (H) Effects of BORIS and 5-azadC on CST form FTotal expression were analyzed by transient transfection of a expression vector into NIH 3T3 cells either treated or not with 1 μM 5-azadC. Expression of CST form FTotal was analyzed by qPCR (n = 3). Cells were cultured with or without 5-azadC for 24 h followed by transient transfection. Cells were further cultured for 48 h and harvested for analysis. Expression levels are shown as the ratio to empty vector-transfected cells without 5-azadC. *, statistically significant versus empty vector-transfected cells without 5-azadC (P < 0.01); **, statistically significant versus empty vector-transfected cells with 5-azadC (P < 0.005). E, empty vector; B, BORIS; C, CTCF.

Similar articles

Cited by

References

    1. Albrecht, K. H., M. Young, L. L. Washburn, and E. M. Eicher. 2003. Sry expression level and protein isoform differences play a role in abnormal testis development in C57BL/6J mice carrying certain Sry alleles. Genetics 164:277-288. - PMC - PubMed
    1. Amelio, A. L., P. K. McAnany, and D. C. Bloom. 2006. A chromatin insulator-like element in the herpes simplex virus type 1 latency-associated transcript region binds CCCTC-binding factor and displays enhancer-blocking and silencing activities. J. Virol. 80:2358-2368. - PMC - PubMed
    1. Bell, A. C., A. G. West, and G. Felsenfeld. 1999. The protein CTCF is required for the enhancer blocking activity of vertebrate insulators. Cell 98:387-396. - PubMed
    1. Bourc'his, D., and T. H. Bestor. 2004. Meiotic catastrophe and retrotransposon reactivation in male germ cells lacking Dnmt3L. Nature 431:96-99. - PubMed
    1. Chau, C. M., X. Y. Zhang, S. B. McMahon, and P. M. Lieberman. 2006. Regulation of Epstein-Barr virus latency type by the chromatin boundary factor CTCF. J. Virol. 80:5723-5732. - PMC - PubMed

Publication types