. 2010 Mar 22;188(6):891-903.
doi: 10.1083/jcb.200907174. Epub 2010 Mar 15.

Focal adhesions are sites of integrin extension

Affiliations

Focal adhesions are sites of integrin extension

Janet A Askari et al. J Cell Biol. .

Abstract

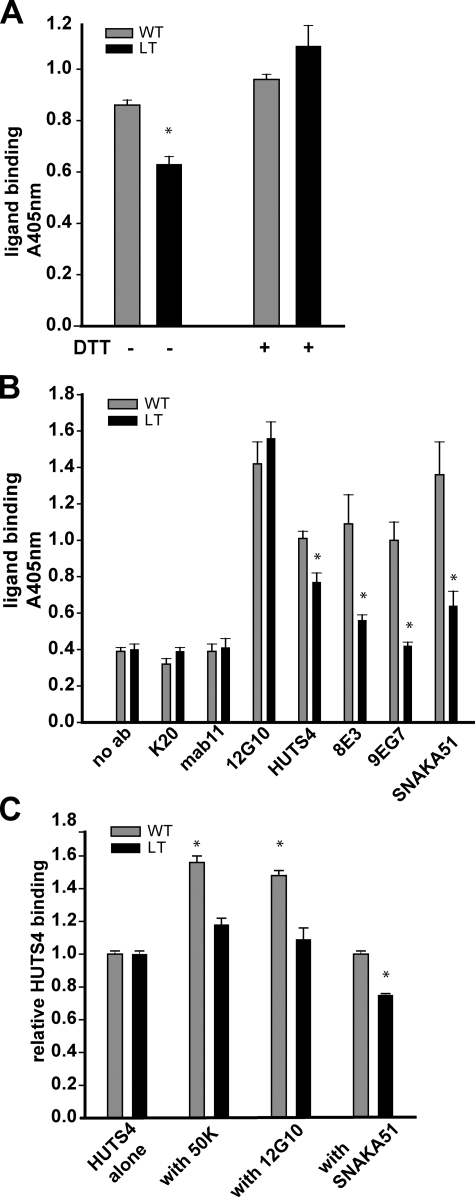
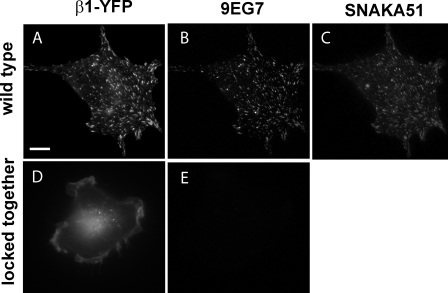
Integrins undergo global conformational changes that specify their activation state. Current models portray the inactive receptor in a bent conformation that upon activation converts to a fully extended form in which the integrin subunit leg regions are separated to enable ligand binding and subsequent signaling. To test the applicability of this model in adherent cells, we used a fluorescent resonance energy transfer (FRET)-based approach, in combination with engineered integrin mutants and monoclonal antibody reporters, to image integrin alpha5beta1 conformation. We find that restricting leg separation causes the integrin to adopt a bent conformation that is unable to respond to agonists and mediate cell spreading. By measuring FRET between labeled alpha5beta1 and the cell membrane, we find extended receptors are enriched in focal adhesions compared with adjacent regions of the plasma membrane. These results demonstrate definitely that major quaternary rearrangements of beta1-integrin subunits occur in adherent cells and that conversion from a bent to extended form takes place at focal adhesions.


Figures

Figure 1.
Figure 1.
Preventing leg separation at the calf-2/βTD interface of soluble α5β1-Fc induces bending of the molecule. (A) Diagram showing the approximate location of the epitopes of the anti-α5 and -β1 antibodies used in this study. The reagents include the activating anti-β1 mAbs 12G10 (βA domain; Mould et al., 1995), HUTS4 (hybrid domain; Mould et al., 2003a), 8E3 (PSI domain; Mould et al., 2005), 9EG7 (I-EGF2-4; Bazzoni et al., 1995), and the activating anti-α5 SNAKA51 (calf1-calf2; Clark et al., 2005). The nonfunction perturbing anti-β1 K20 (I-EGF region; Amiot et al., 1986) and anti-α5 mAb11 (calf1-calf2; LaFlamme et al., 1992) and VC5 (β-propeller; Tran Van Nhieu and Isberg, 1993) are also highlighted. The approximate location of the engineered inter-subunit disulphide bond is indicated. (B) Homology model of α5β1 in the region defined by dotted lines in A. The homology model was built based on an alignment against the αIIbβ3 crystal structure (PDB 3FCS; Zhu et al., 2008), using the same procedures as described previously (Mould et al., 2002). The α5 calf-2 domain is in blue and I-EGF4 and βTD of the β1 subunit are in red. The residues selected for mutation to cysteine to form the inter-subunit disulphide bond, Lys758 in α5 and Gly618 in β1, are shown in CPK form in green. (C) WT or LT α5β1-Fc was purified from culture supernatant and then incubated with Tobacco Etch Virus protease (TEV) to remove the Fc domain from the β-subunit. 3–8% SDS-PAGE gel showing α5β1-Fc dimer (black arrowhead, Mr ∼300 kD) that dissociates upon TEV protease treatment in WT (lane 2) but not LT (lane 4) integrin. Reduction of the disulphide bond separates LT into its two subunits (gray arrowhead, α5-Fc Mr ∼145 kD, β1-Fc ∼140 kD). The band at 150 kD in nonreduced samples is contaminating bovine Ig from culture medium. This dissociates upon reduction into its component 50- and 25-kD subunits not included in the figure. Numbers to the left of the gel indicate the position of Mr markers. (D) WT or LT α5β1-Fc was captured onto anti–human Fc-coated ELISA plates and the binding of activating anti-α5 (SNAKA51) and anti-β1 (12G10, HUTS4, 8E3, and 9EG7) antibodies to WT (gray bars) and LT (black bars) α5β1-Fc compared with nonfunction perturbing anti-α5 (mAb11) and anti-β1 (K20) in the presence of 1 mM each of Ca2+ and Mg2+. DTT was included at 250 µM where indicated. Error bars show ±SD of three separate experiments. (*, P = 0.001; t test). (E) Binding of K20 (gray bars) or 9EG7 (black bars) to WT α5β1-Fc, α5β1(S582T)-Fc, and α5β1(D522E)-Fc. Error bars indicate ±SD of three separate experiments. (F) Homology model of extracellular domain of α5β1 showing the position of the 9EG7 epitope at D522 in I-EGF2, which is colored green with D522 represented in CPK form. For clarity, the integrin headpiece (α5 β-propeller and βA domain) is not included. The model was prepared as in panel B.
Figure 2.
Figure 2.
Restraining leg separation of soluble α5β1-Fc at the calf-2/βTD interface impairs ligand binding and abrogates the ability of activating antibodies to stimulate ligand binding. (A) Fc-capture ELISA showing binding of FN fragment (type III repeats 6–10; 50K) to WT (gray bars) and LT α5β1-Fc (black bars) before and after treatment with 250 µM DTT in the presence of 1mM Mn2+. (B) Fc-capture ELISA showing binding of 50K to WT (gray bars) and LT (black bars) α5β1-Fc together with activating anti-α5 (SNAKA51) and anti-β1 (12G10, HUTS4, 8E3, and 9EG7) antibodies, compared with nonfunction-perturbing anti-α5 (mAb11) and anti-β1 (K20) in the presence of 1 mM each of Ca2+ and Mg2+ (*, P = 0.001; t test). (C) Fc-capture ELISA showing the effects of various α5β1 agonists on the binding of HUTS4 to WT and LT α5β1-Fc. Error bars indicate ±SD for three separate experiments. *, P < 0.001; t test.
Figure 3.
Figure 3.
TCSPC-FLIM–based FRET analysis of conformation differences of integrin α5β1 in HFF cells spread on FN. Representative HFF cells spread on FN and stained with Alexa 546-VC5-Fab fragment (the donor, panels A and B) either with (top row) or without (bottom row) fluorescent membrane stain DiD (the acceptor). C and D show false-colored FLIM images representing donor fluorescence lifetimes from individual pixels. Short lifetimes are located toward the red end and long lifetimes toward the blue end of the spectrum. (E) DiD staining. (F) Average lifetimes (in picoseconds; ps) of Alexa 546 fluorescence measured in adhesions complexes (FA) and in areas between adhesion complexes in the cell membrane of the cells illustrated in A and B. n = 50 measurements each from each cell, error bars indicate ±SD (*, P < 0.001; t test). (G) Graph showing FRET efficiencies over a range of acceptor densities in different cells within adhesion complexes (triangles) and in the adjacent cell membrane (squares). n = >20 measurements from each of 12 cells. Error bars indicate ±SD.
Figure 4.
Figure 4.
Restraining leg separation perturbs α5β1 function in vivo. (A) β1-integrin was immunoprecipitated from lysates of GD25 cells expressing either WT or LT α5CFPβ1YFP 24 h after transfection, followed by immunoblotting for integrin α5 (antibody H-104; Santa Cruz Biotechnology, Inc.). Black arrowhead indicates a 300-kD band corresponding to LT integrin, which dissociates upon reduction into component subunits (gray arrowhead). Numbers to the left of the gel indicate position of Mr markers. (B) GD25 cells expressing WT or LT α5CFPβ1YFP co-stained with 9EG7-Alexa 647 to detect active integrin. Cells were treated with 1 mM DTT during spreading where indicated. Bar, 10 µm. (C) Quantification of the ratio of fluorescence intensities of 9EG7 staining to total β1YFP in β1-integrin clusters. n = fluorescence intensity measurements of 100 clusters from at least 10 cells for each condition. Error bars indicate ±SD. (D) The same cells were co-stained with SNAKA51-Alexa 555 to detect ligand-bound α5β1. The fluorescence intensity profiles depict the area of the yellow line drawn in image overlays and compare the fluorescence intensities of total β1 (β1-YFP; green), total α5 (α5-CFP; blue), and SNAKA51 (red). (E) Quantification of the ratio of fluorescence intensities of SNAKA51 staining to total α5-CFP in β1-integrin clusters. n = fluorescence intensity measurements of 100 clusters from at least 10 cells for each condition. Error bars indicate ±SD. Bar, 10 µm.
Figure 5.
Figure 5.
Spreading of GD25 cells expressing WT or LT α5β1 on CRRETAWAC-IgG. GD25 cells transiently expressing either WT or LT α5CFPβ1YFP were allowed to spread on CRRETAWAC-IgG for 60 min, fixed, and stained with 9EG7-Alexa 647 and SNAKA51-Alexa 555. (A and D) β1-YFP fluorescence; (B and E) 9EG7 staining; (C) SNAKA51 staining. Bar, 10 µm.

Similar articles

Cited by

References

    1. Adair B.D., Xiong J.P., Maddock C., Goodman S.L., Arnaout M.A., Yeager M. 2005. Three-dimensional EM structure of the ectodomain of integrin αVβ3 in a complex with fibronectin. J. Cell Biol. 168:1109–1118 10.1083/jcb.200410068 - DOI - PMC - PubMed
    1. Amiot M., Bernard A., Tran H.C., Leca G., Kanellopoulos J.M., Boumsell L. 1986. The human cell surface glycoprotein complex (gp 120,200) recognized by monoclonal antibody K20 is a component binding to phytohaemagglutinin on T cells. Scand. J. Immunol. 23:109–118 10.1111/j.1365-3083.1986.tb01948.x - DOI - PubMed
    1. Bazzoni G., Shih D.T., Buck C.A., Hemler M.E. 1995. Monoclonal antibody 9EG7 defines a novel β 1 integrin epitope induced by soluble ligand and manganese, but inhibited by calcium. J. Biol. Chem. 270:25570–25577 10.1074/jbc.270.30.17784 - DOI - PubMed
    1. Bazzoni G., Ma L., Blue M.L., Hemler M.E. 1998. Divalent cations and ligands induce conformational changes that are highly divergent among beta1 integrins. J. Biol. Chem. 273:6670–6678 10.1074/jbc.273.12.6670 - DOI - PubMed
    1. Beglova N., Blacklow S.C., Takagi J., Springer T.A. 2002. Cysteine-rich module structure reveals a fulcrum for integrin rearrangement upon activation. Nat. Struct. Biol. 9:282–287 10.1038/nsb779 - DOI - PubMed

Publication types