

Antibiotic dose impact on resistance selection in the community: a mathematical model of beta-lactams and Streptococcus pneumoniae dynamics
- PMID: 20231396
- PMCID: PMC2876390
- DOI: 10.1128/AAC.00331-09
Antibiotic dose impact on resistance selection in the community: a mathematical model of beta-lactams and Streptococcus pneumoniae dynamics
Abstract
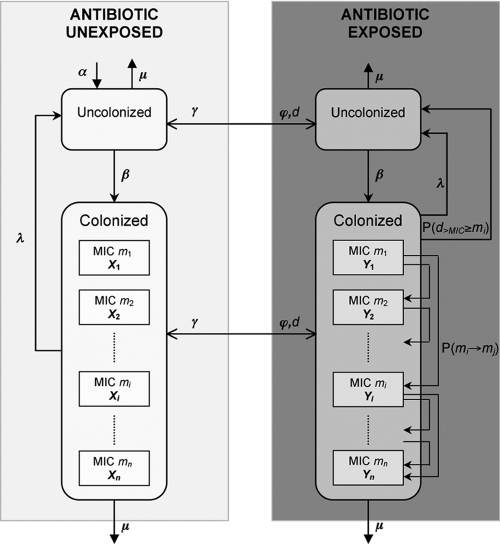
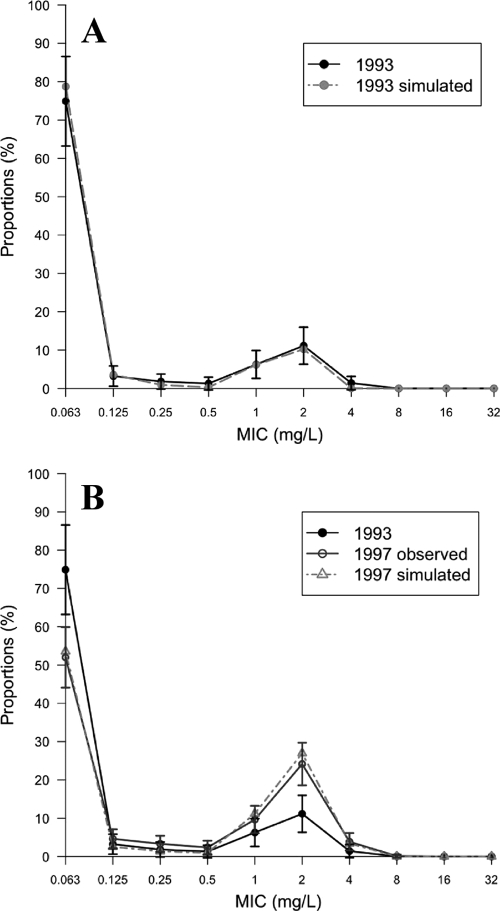
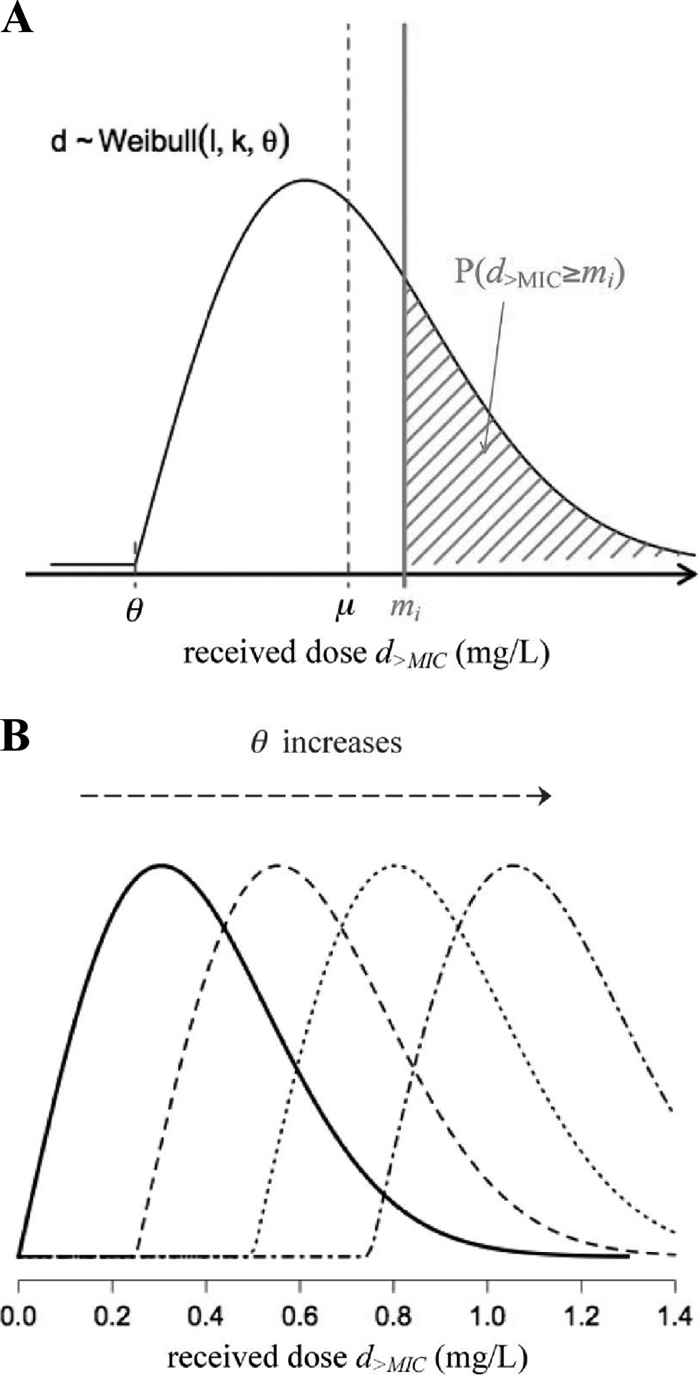
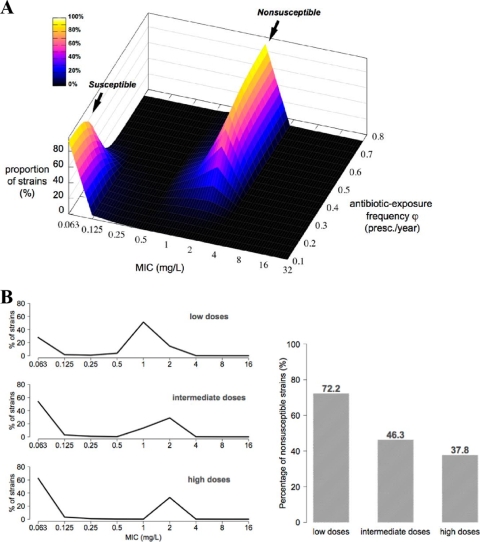
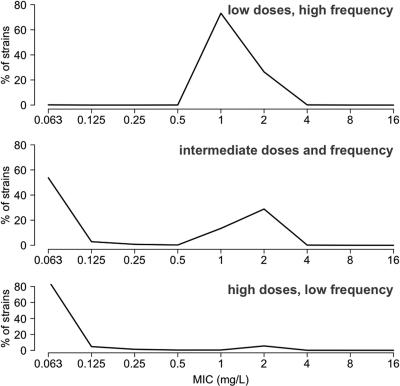
Streptococcus pneumoniae is a major pathogen in the community and presents high rates of resistance to the available antibiotics. To prevent antibiotic treatment failure caused by highly resistant bacteria, increasing the prescribed antibiotic dose has recently been suggested. The aim of the present study was to assess the influence of beta-lactam prescribed doses on the emergence of resistance and selection in the community. A mathematical model was constructed by combining S. pneumoniae pharmacodynamic and population-dynamic approaches. The received-dose heterogeneity in the population was specifically modeled. Simulations over a 50-year period were run to test the effects of dose distribution and antibiotic exposure frequency changes on community resistance patterns, as well as the accuracy of the defined daily dose as a predictor of resistance. When the frequency of antibiotic exposure per year was kept constant, dose levels had a strong impact on the levels of resistance after a 50-year simulation. The lowest doses resulted in a high prevalence of nonsusceptible strains (> or =70%) with MICs that were still low (1 mg/liter), whereas high doses resulted in a lower prevalence of nonsusceptible strains (<40%) and higher MICs (2 mg/liter). Furthermore, by keeping the volume of antibiotics constant in the population, different patterns of use (low antibiotic dose and high antibiotic exposure frequency versus high dose and low frequency) could lead to markedly different rates of resistance distribution and prevalence (from 10 to 100%). Our results suggest that pneumococcal resistance patterns in the community are strongly related to the individual beta-lactam doses received: limiting beta-lactam use while increasing the doses could help reduce the prevalence of resistance, although it should select for higher levels of resistance. Surveillance networks are therefore encouraged to collect both daily antibiotic exposure frequencies and individual prescribed doses.
Figures
Similar articles
-
[Antibiotic therapy for community acquired Streptococcus pneumoniae pneumonia: clinical relevance of antibiotic resistance].Med Mal Infect. 2006 Nov-Dec;36(11-12):667-79. doi: 10.1016/j.medmal.2006.05.008. Epub 2006 Jul 13. Med Mal Infect. 2006. PMID: 16842956 Review. French.
-
Outpatient antibiotic prescribing and nonsusceptible Streptococcus pneumoniae in the United States, 1996-2003.Clin Infect Dis. 2011 Oct;53(7):631-9. doi: 10.1093/cid/cir443. Clin Infect Dis. 2011. PMID: 21890767
-
Empiric first-line antibiotic treatment of acute otitis in the era of the heptavalent pneumococcal conjugate vaccine.Pediatrics. 2006 Jun;117(6):e1087-94. doi: 10.1542/peds.2005-2651. Pediatrics. 2006. PMID: 16740811
-
Therapeutic options among broad-spectrum beta-lactams for infections caused by levofloxacin-nonsusceptible Streptococcus pneumoniae.Diagn Microbiol Infect Dis. 2005 Jun;52(2):129-33. doi: 10.1016/j.diagmicrobio.2004.12.009. Diagn Microbiol Infect Dis. 2005. PMID: 15964501
-
Clinical relevance of antimicrobial resistance in the management of pneumococcal community-acquired pneumonia.J Lab Clin Med. 2004 May;143(5):269-83. doi: 10.1016/j.lab.2004.02.002. J Lab Clin Med. 2004. PMID: 15122171 Review.
Cited by
-
Lyophilized Human Bone Allograft as an Antibiotic Carrier: An In Vitro and In Vivo Study.Antibiotics (Basel). 2022 Jul 19;11(7):969. doi: 10.3390/antibiotics11070969. Antibiotics (Basel). 2022. PMID: 35884224 Free PMC article.
-
The uncertain role of substandard and falsified medicines in the emergence and spread of antimicrobial resistance.Nat Commun. 2023 Oct 3;14(1):6153. doi: 10.1038/s41467-023-41542-w. Nat Commun. 2023. PMID: 37788991 Free PMC article. Review.
-
On being the right size: the impact of population size and stochastic effects on the evolution of drug resistance in hospitals and the community.PLoS Pathog. 2011 Apr;7(4):e1001334. doi: 10.1371/journal.ppat.1001334. Epub 2011 Apr 14. PLoS Pathog. 2011. PMID: 21533212 Free PMC article.
-
Application of dynamic modelling techniques to the problem of antibacterial use and resistance: a scoping review.Epidemiol Infect. 2018 Dec;146(16):2014-2027. doi: 10.1017/S0950268818002091. Epub 2018 Jul 31. Epidemiol Infect. 2018. PMID: 30062979 Free PMC article.
-
Clinical practice guidelines for acute otitis media in children: a systematic review and appraisal of European national guidelines.BMJ Open. 2020 May 5;10(5):e035343. doi: 10.1136/bmjopen-2019-035343. BMJ Open. 2020. PMID: 32371515 Free PMC article.
References
-
- Andersson, D. I. 2006. The biological cost of mutational antibiotic resistance: any practical conclusions? Curr. Opin. Microbiol. 9:461-465. - PubMed
-
- Ball, P. 2007. Conclusions: the future of antimicrobial therapy-Augmentin and beyond. Int. J. Antimicrob. Agents 30(Suppl.):S139-S141. - PubMed
-
- Cars, O., S. Molstad, and A. Melander. 2001. Variation in antibiotic use in the European Union. Lancet 357:1851-1853. - PubMed
Publication types
MeSH terms
Substances
LinkOut - more resources
Full Text Sources
Medical
