. 2010 Mar 30;107(13):6028-33.
doi: 10.1073/pnas.1001796107. Epub 2010 Mar 15.

Hypothalamic and pituitary c-Jun N-terminal kinase 1 signaling coordinately regulates glucose metabolism

Affiliations

Hypothalamic and pituitary c-Jun N-terminal kinase 1 signaling coordinately regulates glucose metabolism

Bengt F Belgardt et al. Proc Natl Acad Sci U S A. .

Abstract

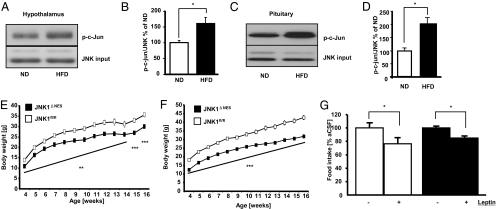
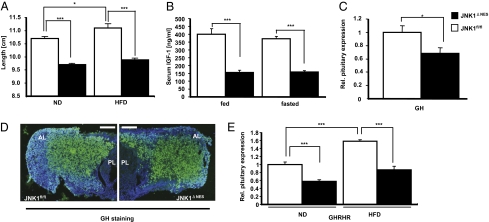
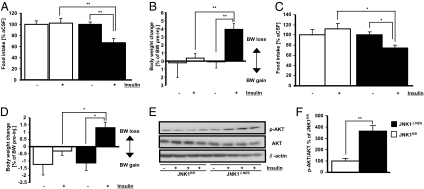
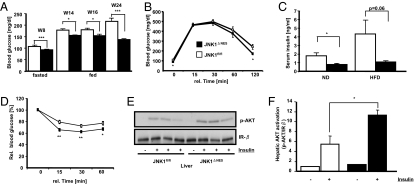
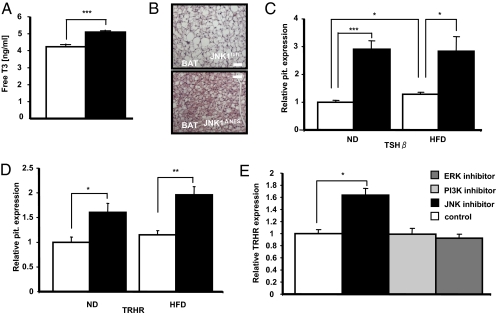
c-Jun N-terminal kinase (JNK) 1-dependent signaling plays a crucial role in the development of obesity-associated insulin resistance. Here we demonstrate that JNK activation not only occurs in peripheral tissues, but also in the hypothalamus and pituitary of obese mice. To resolve the importance of JNK1 signaling in the hypothalamic/pituitary circuitry, we have generated mice with a conditional inactivation of JNK1 in nestin-expressing cells (JNK1(DeltaNES) mice). JNK1(DeltaNES) mice exhibit improved insulin sensitivity both in the CNS and in peripheral tissues, improved glucose metabolism, as well as protection from hepatic steatosis and adipose tissue dysfunction upon high-fat feeding. Moreover, JNK1(DeltaNES) mice also show reduced somatic growth in the presence of reduced circulating growth hormone (GH) and insulin-like growth factor 1 (IGF1) concentrations, as well as increased thyroid axis activity. Collectively, these experiments reveal an unexpected, critical role for hypothalamic/pituitary JNK1 signaling in the coordination of metabolic/endocrine homeostasis.


Conflict of interest statement

The authors declare no conflict of interest.

Figures

Fig. 1.
Fig. 1.
JNK1ΔNES mice show reduced body weight but unchanged leptin sensitivity. (A) High-fat diet (HFD) feeding increases hypothalamic JNK activation. C57bl/6 mice were fed either ND or HFD for 8 weeks, and hypothalami were microdissected. Total JNK activity in this tissue was measured by performing JNK kinase assays, and phosphorylation of the JNK target c-Jun was detected by immunoblot. JNK1/3 loading was used as input control. A representative immunoblot from one ND and one HFD animal is shown. (B) Quantification of HFD-induced JNK activation in the hypothalamus. The ratio of p-c-Jun to JNK1/3 input was quantified in Western blots of hypothalami from 8 ND and 8 HFD-fed animals as shown in A. (C) High-fat diet (HFD) feeding increases pituitary JNK activation. C57bl/6 mice were fed either ND or HFD for 8 weeks, and pituitaries were isolated. Total JNK activity in this tissue was measured by performing JNK kinase assays, and phosphorylation of the JNK target c-Jun was detected by immunoblot. JNK1/3 loading was used as input control. A representative immunoblot from one ND and one HFD animal is shown. (D) Quantification of HFD-induced JNK activation in the pituitary. The ratio of p-c-Jun to JNK1/3 input was quantified in Western blots of pituitaries from 4 ND and 4 HFD-fed animals as shown in C. (E) Average body weight of JNK1fl/fl (▫) and JNK1ΔNES (■) mice on normal diet (n = 12 per group). (F) Average body weight of JNK1fl/fl (▫) and JNK1ΔNES (■) mice on high-fat diet (n = 12 per group). (G) Twenty-four-hour food intake after intracerebroventricular leptin treatment in JNK1fl/fl (▫) (n = 5) and JNK1ΔNES (■) mice (n = 4) mice on normal diet at the age of 12 weeks. Mice were injected with either vehicle or 2 μg leptin immediately before onset of dark phase, and food intake was measured 24 h later. Displayed values are means ± SEM. *, P ≤ 0.05; **, P ≤ 0.01; ***, P ≤ 0.001.
Fig. 2.
Fig. 2.
JNK1ΔNES mice show decreased activation of the somatotrophic axis. (A) Naso-anal length of JNK1fl/fl (▫) (n = 9 vs. 9) and JNK1ΔNES (■) (n = 9 vs. 9) on normal or high-fat diet at the age of 16 weeks. (B) Serum IGF1 concentrations of JNK1fl/fl (▫) (n = 10) and JNK1ΔNES (■) (n = 10) on normal diet either random fed or fasted at the age of 10 weeks. (C) Pituitary expression of GH of JNK1fl/fl (▫) (n = 6) and JNK1ΔNES (■) mice (n = 6) at the age of 16 weeks as measured by real-time–PCR. (D) Immunohistochemistry for GH from pituitary sections of JNK1fl/fl (▫) and JNK1ΔNES (■) mice at the age of 16 weeks (green, GH; blue, DAPI). At least 3 mice of each genotype were analyzed. (Original magnification, ×100.) (Scale bar, 80 μm.) PL, posterior lobe; AL, anterior lobe. (E) Pituitary expression of GHRHR of JNK1fl/fl (▫) (n = 6) and JNK1ΔNES (■) mice (n = 6) fed either normal chow diet or high-fat diet at the age of 16 weeks as measured by real-time PCR. Displayed values are means ± SEM. *, P ≤ 0.05; **, P ≤ 0.01; ***, P ≤ 0.001.
Fig. 3.
Fig. 3.
JNK1ΔNES mice show increased hypothalamic insulin sensitivity. (A) Twenty-four-hour food intake after intracerebroventricular insulin treatment in JNK1fl/fl (▫) (n = 9) and JNK1ΔNES (■) (n = 8) mice on normal diet at the age of 12 weeks. Mice were injected with either vehicle or 2 mU insulin immediately before onset of dark phase, and food intake was measured 24 h later. (B) Body weight loss 24 h after intracerebroventricular insulin treatment in JNK1fl/fl (▫) (n = 9) and JNK1ΔNES (■) (n = 8) mice on normal diet at the age of 12 weeks. Mice were injected with either vehicle or 2 mU insulin immediately before onset of dark phase, and body weight was measured 24 h later. Shown is percent change of body weight after insulin injection compared to vehicle injection. (C) Twenty-four-hour food intake after intracerebroventricular insulin treatment in JNK1fl/fl (▫) (n = 5) and JNK1ΔNES (■) (n = 5) mice on high-fat diet at the age of 10 weeks. Mice were injected with either vehicle or 4 mU insulin immediately before onset of dark phase, and food intake was measured 24 h later. (D) Body weight change 24 h after intracerebroventricular insulin treatment in JNK1fl/fl (▫) (n = 5) and JNK1ΔNES (■) (n = 5) mice on high-fat diet at the age of 10 weeks. Mice were injected with either vehicle or 4 mU insulin immediately before onset of dark phase, and body weight was measured 24 h later. Shown is percent change of body weight after insulin injection compared to ACSF injection. (E) Hypothalamic AKT activation upon icv insulin treatment is improved in JNK1ΔNES mice. JNK1fl/fl and JNK1ΔNES mice on high-fat diet at the age of 10 weeks were fasted for 48 h, injected with ACSF or 4 mU insulin, and killed 20 min later. Immunoblot was performed for phosphorylated (activated) AKT, total AKT, and β-actin protein content. (F) Quantification of insulin-induced AKT phosphorylation compared to total AKT content shown in Fig. 3E. N = 3 per group. Displayed values are means ± SEM. *, P ≤ 0.05; **, P ≤ 0.01; ***, P ≤ 0.001.
Fig. 4.
Fig. 4.
JNK1ΔNES mice show improved glucose homeostasis and elevated insulin sensitivity. (A) Fasted and fed blood glucose concentration of JNK1fl/fl (▫) and JNK1ΔNES (■) mice on high-fat diet at the indicated ages (n = 10–25 per group). (B) Intraperitoneal glucose tolerance test in JNK1fl/fl (▫) and JNK1ΔNES (■) mice on high-fat diet at the age of 14 weeks (n = 10 per group). (C) Serum insulin concentrations in JNK1fl/fl (▫) and JNK1ΔNES (■) mice on normal and high-fat diet at the age of 8–10 weeks (n = 8 per group). (D) Intraperitoneal insulin tolerance test in JNK1fl/fl (▫) and JNK1ΔNES (■) mice on high-fat diet at the age of 15 weeks (n = 9–10 per group). (E) Insulin-stimulated hepatic AKT-phosphorylation in JNK1fl/fl and JNK1ΔNES mice on high-fat diet at the age of 12 weeks (n = 3 per group). (F) Quantification of insulin-stimulated hepatic AKT phosphorylation as shown in Fig. 4E. Displayed values are means ± SEM. *, P ≤ 0.05; **, P ≤ 0.01; ***, P ≤ 0.001.
Fig. 5.
Fig. 5.
JNK1ΔNES mice show increased activation of the thyrotropic axis. (A) Serum-free T3 concentration of JNK1fl/fl (▫) (n = 8) and JNK1ΔNES (■) mice (n = 8) on normal diet at the age of 10 weeks. ***, P ≤ 0.001. (B) Representative H&E staining of brown adipose tissue of control and JNK1ΔNES mice on high-fat diet at the age of 16 weeks. BAT sections of 3 mice per genotype were analyzed. (C) Pituitary expression of TSHβ of JNK1fl/fl (▫) (n = 6) and JNK1ΔNES (■) mice (n = 6) on normal chow or high-fat diet at the age of 16 weeks as measured by real-time PCR. *, P ≤ 0.05; ***, P ≤ 0.001. (D) Pituitary expression of TRHR of JNK1fl/fl (▫) (n = 6) and JNK1ΔNES (■) mice (n = 6) on normal chow or high-fat diet at the age of 16 weeks as measured by real-time PCR. *, P ≤ 0.05; **, P ≤ 0.01. (E) Expression of TRHR in the rat pituitary cell line GH4C1. Expression of TRHR was measured after 16 h incubation with either 0.1% DMSO (control), SP600125 (JNK inhibitor), LY294002 (PI3K inhibitor), or PD98059 (ERK inhibitor). For each sample within an experiment, triplicate values were averaged and then the means of the real-time–PCR results from three independent experiments were compared. *, P ≤ 0.05.

Similar articles

Cited by

References

    1. Hotamisligil GS, Shargill NS, Spiegelman BM. Adipose expression of tumor necrosis factor-alpha: Direct role in obesity-linked insulin resistance. Science. 1993;259:87–91. - PubMed
    1. Vgontzas AN, et al. Elevation of plasma cytokines in disorders of excessive daytime sleepiness: Role of sleep disturbance and obesity. J Clin Endocrinol Metab. 1997;82:1313–1316. - PubMed
    1. Hotamisligil GS. Inflammation and metabolic disorders. Nature. 2006;444:860–867. - PubMed
    1. Hirosumi J, et al. A central role for JNK in obesity and insulin resistance. Nature. 2002;420:333–336. - PubMed
    1. Nguyen MT, et al. JNK and tumor necrosis factor-alpha mediate free fatty acid-induced insulin resistance in 3T3-L1 adipocytes. J Biol Chem. 2005;280:35361–35371. - PubMed

Publication types

MeSH terms

LinkOut - more resources