. 2010 Apr 20;107(16):7431-6.
doi: 10.1073/pnas.1002301107. Epub 2010 Mar 15.

Plasmacytoid dendritic cells sense hepatitis C virus-infected cells, produce interferon, and inhibit infection

Affiliations

Plasmacytoid dendritic cells sense hepatitis C virus-infected cells, produce interferon, and inhibit infection

Ken Takahashi et al. Proc Natl Acad Sci U S A. .

Abstract

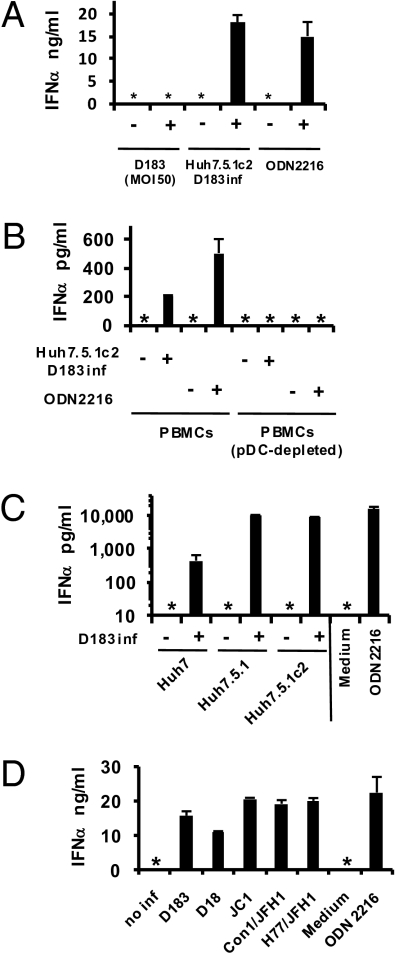
Hepatitis C virus (HCV), a member of the Flaviviridae family, is a single-stranded positive-sense RNA virus that infects >170 million people worldwide and causes acute and chronic hepatitis, cirrhosis, and hepatocellular carcinoma. Despite its ability to block the innate host response in infected hepatocyte cell lines in vitro, HCV induces a strong type 1 interferon (IFN) response in the infected liver. The source of IFN in vivo and how it is induced are currently undefined. Here we report that HCV-infected cells trigger a robust IFN response in plasmacytoid dendritic cells (pDCs) by a mechanism that requires active viral replication, direct cell-cell contact, and Toll-like receptor 7 signaling, and we show that the activated pDC supernatant inhibits HCV infection in an IFN receptor-dependent manner. Importantly, the same events are triggered by HCV subgenomic replicon cells but not by free virus particles, suggesting the existence of a novel cell-cell RNA transfer process whereby HCV-infected cells can activate pDCs to produce IFN without infecting them. These results may explain how HCV induces IFN production in the liver, and they reveal a heretofore unsuspected aspect of the innate host response to viruses that can subvert the classical sensing machinery in the cells they infect, and do not infect or directly activate pDCs.


Conflict of interest statement

The authors declare no conflict of interest.

Figures

Fig. 1.
Fig. 1.
IFNα production by coculture of pDCs and HCV-infected cells. (A) pDCs were inoculated with purified D183 virus at an MOI of 50 or cocultured with D183-infected (3 days) or uninfected Huh7.5.1c2 cells. After 24 h, IFNα production was assessed by ELISA. ODN2216 was included at 1 μM. (B) PBMCs (2 × 10⁵) or a pDC-depleted fraction of PBMCs were cocultured (24 h) with D183-infected (3 days) or uninfected Huh7.5.1c2 cells. IFNα production was assessed by ELISA. (C) pDCs were cocultured (24 h) with D183-infected (7 days) or uninfected Huh7, Huh7.5.1, or Huh7.5.1c2 cells at an MOI of 0.01. IFNα production was assessed by ELISA. (D) pDCs were cocultured (24 h) with Huh7.5.1c2 cells infected (7 days) or not with the indicated HCV strains at an MOI of 0.01. IFNα production was assessed by ELISA. n = 3, mean values ± SD (AC); n = 2, mean values ± average deviation (AVEDEV) (D). No inf, not infected; inf, infected; *, not detected, <12.5 pg/mL.
Fig. 2.
Fig. 2.
Kinetics of IFNα production by pDCs. (A) pDCs were cocultured (24 h) with D183-infected Huh7.5.1c2 cells as indicated (left) or D183-infected (3 days) Huh7.5.1c2 cells that were treated with BILN2061 (1 μM) before coculture as indicated (right). IFNα secretion and intracellular HCV RNA were assessed by ELISA and RT-qPCR, respectively. (B) pDCs were cocultured with D183-infected (3 days) or uninfected Huh7.5.1c2 cells or stimulated by ODN2216 (1 μM) for the indicated periods of time and IFNα production was assessed by ELISA. (C) Cocultured cell mixtures in B were analyzed for MxA, ISG15, and ISG56 mRNA induction by RT-qPCR. Results are displayed as fold induction relative to uninfected cells. (D) Huh7.5.1c2 cells (2.5 × 10⁴) were treated or not with 10 μg/mL anti-IFNα/β receptor antibody (IFNα/β R Ab) (1 h), followed by incubation (2 h) with recombinant IFNα (100 U/mL), control media, or supernatants that were harvested 24 h after coculture of pDCs and D183-infected (3 days) Huh7.5.1c2 cells (inf sup). Then cells were inoculated with D183 virus at an MOI of 0.1. After 48 h, levels of intracellular HCV RNA were monitored by RT-qPCR. Results are displayed as the percentage of HCV RNA in the media control in the absence of anti-IFNα/β receptor antibody. n = 3, mean values ± SD (AC); n = 2, mean values ± AVEDEV (D). Inf, infected.
Fig. 3.
Fig. 3.
Contribution of HCV-infected cells to type 1 IFN induction. pDCs were cocultured with D183-infected (3 days) or uninfected Huh7.5.1c2 cells. (A) After 14 h, pDCs were enriched as described in Materials and Methods, and RNA from pDC-enriched and pDC-depleted fractions were subjected to IFNα and IFNβ mRNA analysis by RT-qPCR. Results are displayed as the percentage of expression in cocultured cell mixtures before pDC enrichment (n = 2, mean values ± AVEDEV). (B) After 14 h of incubation individually or together with pDCs, D183-infected or uninfected Huh7.5.1c2 cells and cocultured mixtures were stained for IFNα, CD123, and BDCA-2. The results for the total mixed-cell population and for cells gated on cell size, granularity, CD123 positivity, and BDCA-2 positivity (i.e., pDCs) are displayed in the left and right panels, respectively. D183-infected Huh7.5.1c2 cells and mixed cultures are shown in the upper and lower panels, respectively. Note that the pDC-gated population of cocultured IFNα-producing cells does not contain Huh7.5.1c2 cells (compare right upper and lower panels) and that IFNα-producing cells in the mixed population mirror the same population in the pDC-gated fraction (compare left and right lower panels). Inf, infected.
Fig. 4.
Fig. 4.
Mechanisms of type 1 IFN production by pDCs. (A) pDCs were cocultured (24 h) with D183-infected (2 days) Huh7.5.1c2 cells in the presence or absence of 10 μg/mL anti-IFNα/β receptor antibody or 10 μg/mL anti-HCV E2 antibody, or they were separated by a transwell insert, and IFNα production was assessed by ELISA. (B) pDCs were cocultured (24 h) with Huh7.5.1c2 cells transfected 48 h before coculture with 10 μg in vitro synthesized RNA of wild-type (WT) or replication-defective GND mutant of JFH1 subgenomic replicon (SGR), or Huh7.5.1c2 cells bearing JFH1 SGR. IFNα production and HCV RNA was assessed by ELISA (upper panel) and RT-qPCR (lower panel), respectively. (C) pDCs were preincubated with 0.175 μM IRS661, control ODN, or media for 30 min, and cocultured with D183-infected (2 days) Huh7.5.1c2 cells or stimulated by resiquimod (50 ng/mL) or ODN2216 (1 μM). After 24 h, IFNα production was assessed by ELISA. Results are displayed as the percentage of IFNα produced in the absence of IRS661 or control ODN. (D) pDCs were transfected with 10 μg/mL in vitro synthesized genomic JFH1 RNA formulated with 12.5 μL/mL DOTAP in the presence or absence of 0.175 μM IRS661 or control ODN (lanes 3–5), or stimulated by the same amount of genomic JFH1 RNA or DOTAP alone (lanes 1 and 2). pDCs were also transfected with 10 μg/mL total Huh7 cellular RNA formulated with 12.5 μL/mL DOTAP (lane 6). After 24 h, IFNα production was assessed by ELISA. (E) D183-infected (2 days) Huh7.5.1c2 cells were cocultured (20 h) with pDCs in a chamber slide. Cells were stained for HCV NS3 (red) and TLR7 (green) (left) or for IFNα (yellow), TLR7 (green), and F-actin (red) (right). Nuclei were stained with Hoechst dye (blue). A side view (lower panels) demonstrates the relative location of pDCs and D183-infected cells. Note that the right upper panel reveals three pDCs attached to a single D183-infected cell, only one of which produces IFNα. n = 3 (AD), mean values ± SD. Inf, infected; rep, replicon; *, not detected.
Fig. 5.
Fig. 5.
pDC IFN production triggered by VEE replicon cells. (A) pDCs (1 × 10⁵) were cocultured (24 h) with 2 × 10⁵ Huh7.5.1c2 cells bearing the JFH1 or VEE subgenomic replicon or BDV-infected Huh7.5.1c2 cells. IFNα production and intracellular viral RNA contents were assessed by ELISA (upper) and by RT-qPCR (lower), respectively. (B) pDCs, preincubated with 0.175 μM IRS661, control ODN, or media for 30 min, were cocultured (24 h) with 2 × 10⁵ Huh7.5.1c2 cells bearing the JFH1 or VEE subgenomic replicon. pDCs (6 × 10⁴ and 2 × 10⁴) were cocultured with VEE and JFH1 replicon cells, respectively. IFNα production was assessed by ELISA. Results are displayed as the percentage of IFNα produced in the absence of IRS661 or control ODN. n = 3, mean values ± SD. Inf, infected; rep, replicon; *, not detected.

Comment in

Similar articles

Cited by

References

    1. Chisari FV. Unscrambling hepatitis C virus-host interactions. Nature. 2005;436:930–932. - PubMed
    1. Meylan E, et al. Cardif is an adaptor protein in the RIG-I antiviral pathway and is targeted by hepatitis C virus. Nature. 2005;437:1167–1172. - PubMed
    1. Loo YM, et al. Viral and therapeutic control of IFN-β promoter stimulator 1 during hepatitis C virus infection. Proc Natl Acad Sci USA. 2006;103:6001–6006. - PMC - PubMed
    1. Cheng G, Zhong J, Chisari FV. Inhibition of dsRNA-induced signaling in hepatitis C virus-infected cells by NS3 protease-dependent and -independent mechanisms. Proc Natl Acad Sci USA. 2006;103:8499–8504. - PMC - PubMed
    1. Bigger CB, et al. Intrahepatic gene expression during chronic hepatitis C virus infection in chimpanzees. J Virol. 2004;78:13779–13792. - PMC - PubMed

Publication types

LinkOut - more resources