. 2010 Mar 30;107(13):6064-9.
doi: 10.1073/pnas.0909794107. Epub 2010 Mar 15.

Mechanisms of acute axonal degeneration in the optic nerve in vivo

Affiliations

Mechanisms of acute axonal degeneration in the optic nerve in vivo

Johanna Knöferle et al. Proc Natl Acad Sci U S A. .

Abstract

Axonal degeneration is an initial key step in traumatic and neurodegenerative CNS disorders. We established a unique in vivo epifluorescence imaging paradigm to characterize very early events in axonal degeneration in the rat optic nerve. Single retinal ganglion cell axons were visualized by AAV-mediated expression of dsRed and this allowed the quantification of postlesional acute axonal degeneration (AAD). EM analysis revealed severe structural alterations of the cytoskeleton, cytoplasmatic vacuolization, and the appearance of autophagosomes within the first hours after lesion. Inhibition of autophagy resulted in an attenuation of acute axonal degeneration. Furthermore, a rapid increase of intraaxonal calcium levels following crush lesion could be visualized using a calcium-sensitive dye. Application of calcium channel inhibitors prevented crush-induced calcium increase and markedly attenuated axonal degeneration, whereas application of a calcium ionophore aggravated the degenerative phenotype. We finally demonstrate that increased postlesional autophagy is calcium dependent and thus mechanistically link autophagy and intraaxonal calcium levels. Both processes are proposed to be major targets for the manipulation of axonal degeneration in future therapeutic settings.


Conflict of interest statement

The authors declare no conflict of interest.

Figures
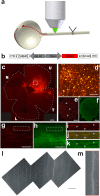
Fig. 1.
Fig. 1.
Visualization of retinal ganglion cell (RGC) axons in the optic nerve (ON) in vivo. (A) Scheme of experimental setup (not to scale). RGCs (red) are labeled by intravitreal injection of AAV vectors expressing dsRed and visualized by epifluorescence. (B) Map of the vector construct (AAV(1/2).hSYN.dsRed). (C) Flatmount of an AAV(1/2).hSYN.dsRed-injected retina showing specific RGC labeling in the upper quadrant (U) by targeted injection. Temporal (T), nasal (N), lower (L), and upper (U) quadrants of the retina. (D) Higher magnification of Inset shown in C demonstrating transfection efficiency and axonal labeling. Transverse (E and F) and longitudinal (G–K) sections of transfected ON showing localized transfection of axons (arrows), dsRed (red, E, G, and I), phosphorylated neurofilaments (green, F, H, and K). (IK) Magnification of Insets shown in G and H, arrows mark single transfected axons; (J) overlay of I and K. (L) Example of an imaging result showing several superficial RGC axons by epifluorescence. (M) Higher magnification of single axon in L. [Scale bars, 1 mm (C); 200 μm (D); 100 μm (EH); 50 μm (L and M).]
Fig. 2.
Fig. 2.
Time course of acute axonal degeneration following ON crush. Overview of the region proximal (A) and distal (C) to the crush site. Red rectangles indicate evaluated axon part in B or D. Distance to the lesion site (tie) is indicated. Axonal changes proximal (B) and distal (D) to crush at indicated time points (min after lesion). (E) Development of axonal integrity ratios for axons distal (open circle; n = 5) and proximal (solid square; n = 6) to the lesion site. AD are composite micrographs. Error bars represent SEM. For statistical analysis ANOVA and Student's t test (two-tailed, heteroscedastic) were used. Differences are considered significant vs. uncrushed ON. *, P < 0.05; **, P < 0.01; ***, P < 0.001.
Fig. 3.
Fig. 3.
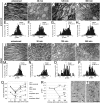
Ultrastructural changes after ON crush. Overview of the ON ultrastructure in the unlesioned control ON (A and I), and 30 min (B and J), 120 min (C and K) and 360 min (D and L) after crush (all longitudinal sections). Local axonal swellings (black arrows) appear earlier proximal than distal to the crush and increase in number and size over time (AD and IL). Early structural defects between axoplasm and myelin sheath distal to the crush (K and L; gray arrows). Histograms of g-ratios of ON fibers after crush (in % frequency, bin width 0.025) (EH and MP). Development of the mean fiber and axoplasm diameter (Q) and the resulting g-ratio (R) over time. Mean g-ratio is given ±SD (EH and MP) or ±SEM (R). LC3-immunogold labeling for autophagosomes (black arrows) 360 min after crush (S and T). **, P < 0.01; ***, P < 0.001 (compared to unlesioned control of the corresponding side), two-tailed, heteroscedastic Student's t test. [Scale bars, 5 μm (AD and IL); 250 nm (S); 100 nm (T).]
Fig. 4.
Fig. 4.
Time course of axonal degeneration following autophagy inhibition by 3-MA. (A) Development of axonal integrity ratios for DMSO-treated (open rectangle; n = 4) and 3-MA-treated (cross; n = 6) animals. Error bars represent SEM. Statistical differences between DMSO- and 3-MA-treated groups: *, P < 0.05; **, P < 0.01; ***, P < 0.001 by ANOVA and Student's t test (two-tailed, heteroscedastic). Axonal changes proximal to crush at indicated time points (min after lesion) in an ON pretreated with 3-MA (B) or DMSO (C).
Fig. 5.
Fig. 5.
Role of intraaxonal calcium levels ([Ca2+]i) for axonal degeneration. (A) [Ca2+]i before and after ON crush in the untreated ON. Single measurements (n = 3). (B) Exemplary images of an ON before and after crush (crush site marked by constricted tie). Time before/after crush indicated in seconds. (C) Time course of axonal degeneration after application of a calcium channel inhibitor mixture (amiloride 100 μM, amlodipin 10 μM, NBQX 1 mM; crosses; n = 5), a calcium ionophore (A23187, 100 μM; open rhomboids; n = 4), or untreated ON (control; solid squares; n = 6). Error bars represent SEM. Statistical differences indicated in relation to control group: *, P < 0.05; **, P < 0.01; ***, P < 0.001 by ANOVA and Student's t test (two-tailed, heteroscedastic). Representative images of axonal changes proximal to crush at indicated time points (min after lesion) after application of the calcium inhibitor mix (D) or the calcium ionophore (E).
Fig. 6.
Fig. 6.
Time course and Ca-dependence of autophagosome accumulation in AAD. (A) Quantification of LC3 positive axonal punctae/mm2 in a native ON (no crush), in ON at 30, 120, and 360 min postcrush and at 360 min postcrush and treatment with a calcium inhibitor mix. **, P < 0.01; *, P < 0.05 vs. no crush, §, P < 0.05 vs. 360 min without calcium inhibitor mix. (B) Pseudoconfocal micrographs of representative areas immunostained against LC3 at 200 μm proximal and distal to the crush corresponding to the quantification in A. (Scale bar in B, 20 μm.)

References

    1. Hagg T, Oudega M. Degenerative and spontaneous regenerative processes after spinal cord injury. J Neurotrauma. 2006;23:264–280. - PubMed
    1. Navarro X. Chapter 27: Neural plasticity after nerve injury and regeneration. Int Rev Neurobiol. 2009;87:483–505. - PubMed
    1. Orimo S, et al. Axonal alpha-synuclein aggregates herald centripetal degeneration of cardiac sympathetic nerve in Parkinson's disease. Brain. 2008;131:642–650. - PubMed
    1. Fischer LR, et al. Amyotrophic lateral sclerosis is a distal axonopathy: Evidence in mice and man. Exp Neurol. 2004;185:232–240. - PubMed
    1. Cavanagh JB. The significance of the “dying back” process in experimental and human neurological disease. Int Rev Exp Pathol. 1964;3:219–267. - PubMed

Publication types

MeSH terms