. 2010 Apr 13;107(15):7036-41.
doi: 10.1073/pnas.1000645107. Epub 2010 Mar 15.

Diabetes-accelerated memory dysfunction via cerebrovascular inflammation and Abeta deposition in an Alzheimer mouse model with diabetes

Affiliations

Diabetes-accelerated memory dysfunction via cerebrovascular inflammation and Abeta deposition in an Alzheimer mouse model with diabetes

Shuko Takeda et al. Proc Natl Acad Sci U S A. .

Abstract

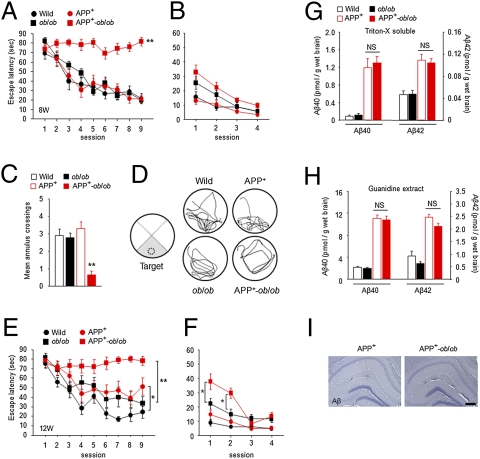
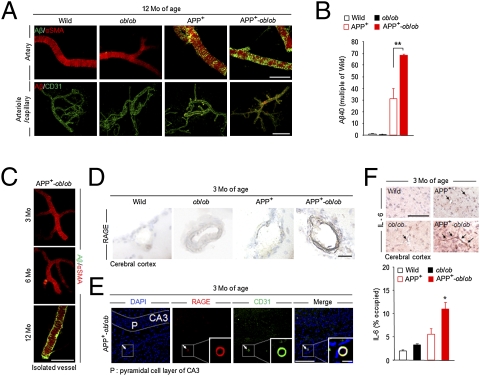
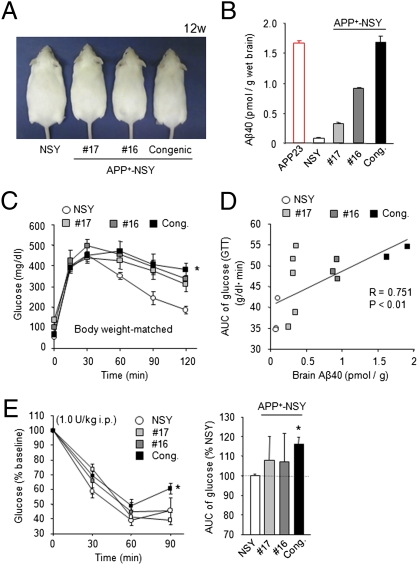
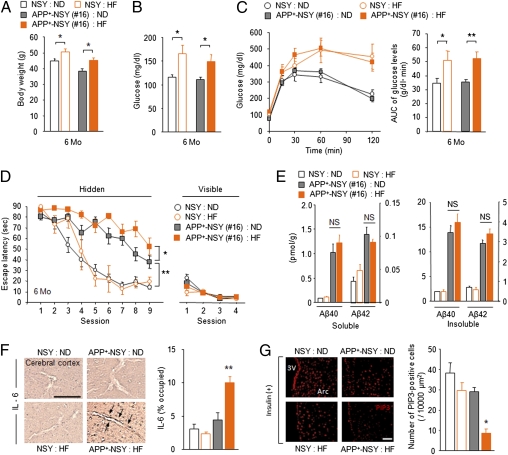
Recent epidemiological studies suggest that diabetes mellitus is a strong risk factor for Alzheimer disease. However, the underlying mechanisms remain largely unknown. In this study, to investigate the pathophysiological interaction between these diseases, we generated animal models that reflect the pathologic conditions of both diseases. We crossed Alzheimer transgenic mice (APP23) with two types of diabetic mice (ob/ob and NSY mice), and analyzed their metabolic and brain pathology. The onset of diabetes exacerbated Alzheimer-like cognitive dysfunction without an increase in brain amyloid-beta burden in double-mutant (APP(+)-ob/ob) mice. Notably, APP(+)-ob/ob mice showed cerebrovascular inflammation and severe amyloid angiopathy. Conversely, the cross-bred mice showed an accelerated diabetic phenotype compared with ob/ob mice, suggesting that Alzheimer amyloid pathology could aggravate diabetes. Similarly, APP(+)-NSY fusion mice showed more severe glucose intolerance compared with diabetic NSY mice. Furthermore, high-fat diet feeding induced severe memory deficits in APP(+)-NSY mice without an increase in brain amyloid-beta load. Here, we created Alzheimer mouse models with early onset of cognitive dysfunction. Cerebrovascular changes and alteration in brain insulin signaling might play a pivotal role in this relationship. These findings could provide insights into this intensely debated association.


Conflict of interest statement

The authors declare no conflict of interest.

Figures

Fig. 1.
Fig. 1.
Metabolic features of APP+-ob/ob mice. (A) Appearance of APP+ and APP+-ob/ob mice at 8 weeks. (B) Body weight changes in WT, APP+, ob/ob, and APP+-ob/ob mice (n = 12–14 per group). Blood glucose levels (C) and plasma insulin concentrations (D) at 8 weeks of age (n = 5–9). (E) Blood glucose levels during glucose tolerance test at 8 weeks (n = 5–14) and AUCs of blood glucose (Right) during GTT. (F and G) ITT in ob/ob and APP+-ob/ob mice (2.0 U/kg, n = 13–17, F), and WT and APP+ mice (0.5 U/kg, n = 5–6; G) at 8 weeks. (H) Immunoblot analysis of Ser473-phosphorylated Akt (pAkt) and total Akt in response to a bolus injection of insulin in skeletal muscle and liver. (I) Densitometric quantification of all immunoblot analysis from H (n = 3–7). (J) Daily food (Left) and water (Middle) intake and urine volume (Right) in ob/ob and APP+-ob/ob mice at 8 weeks (n = 7–9). (K) Basal activity (mean locomotion score) of ob/ob and APP+-ob/ob mice in open-field test (n = 6–9). ##P < 0.01, APP+-ob/ob versus APP+ mice; *P < 0.05 and **P < 0.01, APP+-ob/ob versus ob/ob mice. NS, not significant.
Fig. 2.
Fig. 2.
Exacerbation of learning and memory deficit in APP+-ob/ob mice, without increase in brain Aβ load. (AD) Morris water maze test at 8 weeks. Escape latencies in hidden-platform (A) and visible-platform (B) test, number of annulus crossings (C), and representative swim paths (D) during the probe test are shown (n = 11–17 per group). **P < 0.01 for APP+-ob/ob mice versus other genotypes. “Target” indicates the area where the platform was constantly located in the hidden-platform test. (E and F) Morris water maze test at 12 weeks. Escape latencies in hidden-platform (E) and visible-platform (F) test (n = 11–13). *P < 0.05, **P < 0.01. (G and H) Quantification of brain Aβ40 and Aβ42 concentrations. Both Triton-X–soluble (G) and -insoluble (guanidine extract) (H) Aβ were measured (n = 6–7). (I) Aβ immunostaining (6E10) in brain of APP+ and APP+-ob/ob mice. There was no detectable amyloid plaque at this early age (12 weeks) in either genotype. (Scale bar, 200 μm.)
Fig. 3.
Fig. 3.
Increased vascular amyloid deposition and inflammation in APP+-ob/ob mouse brain. (A) Immunohistochemical detection of Aβ40 deposition in isolated brain microvessels of 12-month-old mice. Brain microvessels were also stained for anti–α-smooth muscle actin (a vascular smooth muscle cell marker) and CD31 (endothelial cell marker). (Scale bar, 100 μm.) (B) Quantification of Aβ40 level in isolated brain microvessels by ELISA (n = 3 per group). **P < 0.01. (C) Cerebrovascular amyloid deposition in APP+-ob/ob mice was age-dependent and appeared after 6 months of age. (Scale bar, 100 μm.) (D) Immunohistochemical staining for RAGE in brain sections of young (3-month-old) mice. Strong immunoreactivity was detected in brain vessels (cerebral cortex) of APP+-ob/ob mice. (Scale bar, 30 μm.) (E) Brain section of 3-month-old APP+-ob/ob mouse immunolabeled for RAGE and CD31 and counterstained with DAPI. Colocalization of RAGE and CD31 in cerebral vessel is denoted by arrow and magnified (Inset). (Scale bars, 100 μm; 10 μm for Inset.) (F) IL-6–positive microvessels (cerebral cortex) in 3-month-old mouse (Left) and quantitative image analysis of IL-6–positive vessels (percent occupied; Right, n = 3). (Scale bar, 100 μm.) *P < 0.05 for APP+-ob/ob mice versus other genotypes.
Fig. 4.
Fig. 4.
Alteration in brain insulin signaling in APP+-ob/ob mice. (A) Quantification of brain insulin concentration by ELISA (n = 5–9). (B) Insulin sensitivity in brain neurons. Insulin-stimulated (5.0 U/kg, i.p.) PIP3 formation in arcuate cells was assessed by immunostaining with anti-PIP3 antibody (Left). (Scale bar, 50 μm.) PIP3-positive cell number in arcuate nucleus of insulin-injected mice is shown in the graph (Right, n = 3). (C) Immunoblot analysis of insulin-stimulated phosphorylation of Akt (pAkt) and total Akt in the brain (Left) and densitometric quantification of them (Right; n = 3–4). *P < 0.05 for APP+-ob/ob mice versus other genotypes. 3V, third ventricle; Arc, arcuate nucleus.
Fig. 5.
Fig. 5.
Metabolic features of APP+-NSY mice. (A) Appearance of APP+-NSY mice (mice 16 and 17 and congenic mice) at 12 weeks. (B) Brain Aβ levels of each APP+-NSY mice lines (12-week-old age). (C) GTT in body weight–matched mice groups. Body weight–matched NSY and APP+-NSY mice were used for the experiment (n = 3–5). *P < 0.05 for APP+-NSY congenic mice compared with NSY mice. (D) Significant positive correlation between brain Aβ levels and glucose intolerance (AUC during GTT) in body weight–matched mice groups. P < 0.01, Spearman rank test. (E) Blood glucose levels during ITT (1.0 U/kg, 12 weeks, n = 4–7). *P < 0.05 for APP+-NSY congenic mice compared with NSY mice. Cong., APP+-NSY congenic mice.
Fig. 6.
Fig. 6.
Aggravation of diabetic conditions induce more severe memory deficits in APP+-NSY mice without an increase in brain Aβ load. (A-C) Five months of HF feeding aggravated diabetic phenotypes of APP+-NSY mice (mouse 16). One-month-old NSY and APP+-NSY mice were fed ND or HF diet for 5 months. (A) Body weight at 6 months of age (n = 10–26). (B) Blood glucose levels in fed state (n = 8–20). (C) Blood glucose levels during GTT (n = 7–20 per group). *P < 0.05, **P < 0.01. (D) Morris water maze test at 6 months (n = 3–15). *P < 0.05, **P < 0.01. (E) Quantification of brain Aβ40 and Aβ42 concentrations. Both soluble (Triton X-100 extract) and insoluble (guanidine extract) Aβ were measured (n = 3–4). (F) IL-6–positive microvessels (cerebral cortex; Left) and quantitative image analysis (Right, n = 4). (Scale bar, 100 μm.) *P < 0.05 for HF-fed APP+-NSY mice versus other groups. (G) Insulin sensitivity in brain neurons. Insulin-stimulated (5.0 U/kg, i.p.) PIP3 formation in arcuate cells was assessed by immunostaining (n = 3). (Scale bar, 50 μm.) 3V, third ventricle; Arc, arcuate nucleus.

Comment in

  • Linking type 2 diabetes and Alzheimer's disease.
    Han W, Li C. Han W, et al. Proc Natl Acad Sci U S A. 2010 Apr 13;107(15):6557-8. doi: 10.1073/pnas.1002555107. Epub 2010 Apr 12. Proc Natl Acad Sci U S A. 2010. PMID: 20385830 Free PMC article. No abstract available.

References

    1. Flier JS. Obesity wars: molecular progress confronts an expanding epidemic. Cell. 2004;116:337–350. - PubMed
    1. Maher PA, Schubert DR. Metabolic links between diabetes and Alzheimer's disease. Expert Rev Neurother. 2009;9:617–630. - PubMed
    1. Ott A, et al. Diabetes mellitus and the risk of dementia: The Rotterdam Study. Neurology. 1999;53:1937–1942. - PubMed
    1. Hardy J, Selkoe DJ. The amyloid hypothesis of Alzheimer's disease: progress and problems on the road to therapeutics. Science. 2002;297:353–356. - PubMed
    1. Gasparini L, Netzer WJ, Greengard P, Xu H. Does insulin dysfunction play a role in Alzheimer's disease? Trends Pharmacol Sci. 2002;23:288–293. - PubMed

Publication types