

MiDReG: a method of mining developmentally regulated genes using Boolean implications
- PMID: 20231483
- PMCID: PMC2851930
- DOI: 10.1073/pnas.0913635107
MiDReG: a method of mining developmentally regulated genes using Boolean implications
Abstract
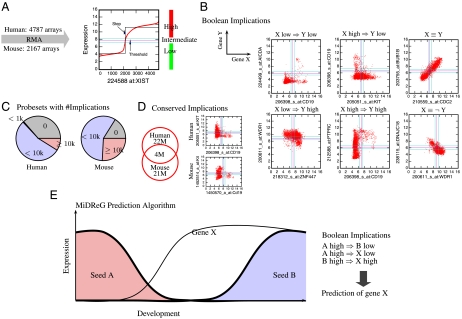
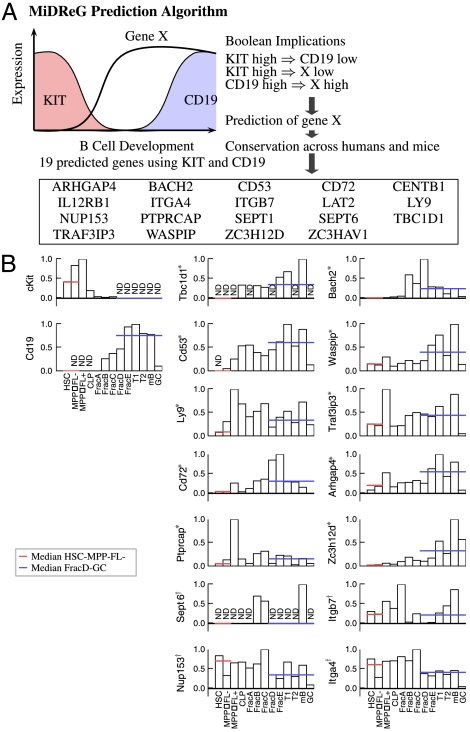
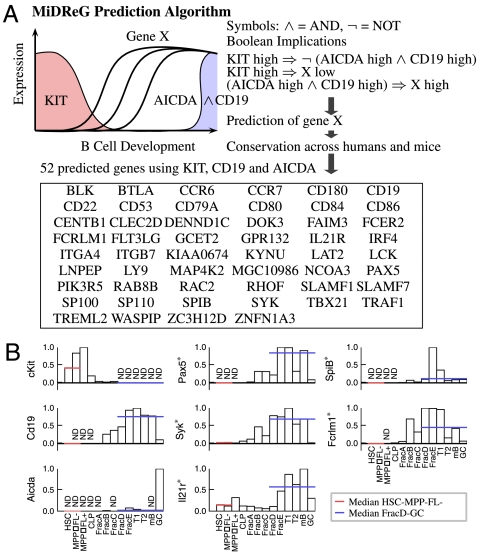
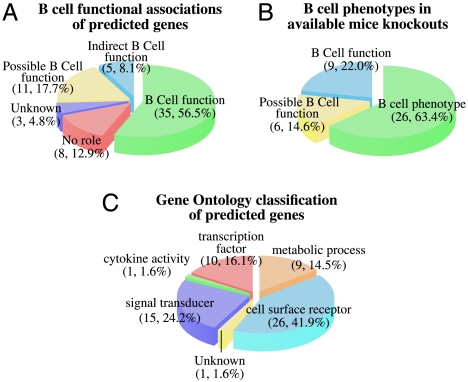
We present a method termed mining developmentally regulated genes (MiDReG) to predict genes whose expression is either activated or repressed as precursor cells differentiate. MiDReG does not require gene expression data from intermediate stages of development. MiDReG is based on the gene expression patterns between the initial and terminal stages of the differentiation pathway, coupled with "if-then" rules (Boolean implications) mined from large-scale microarray databases. MiDReG uses two gene expression-based seed conditions that mark the initial and the terminal stages of a given differentiation pathway and combines the statistically inferred Boolean implications from these seed conditions to identify the relevant genes. The method was validated by applying it to B-cell development. The algorithm predicted 62 genes that are expressed after the KIT+ progenitor cell stage and remain expressed through CD19+ and AICDA+ germinal center B cells. qRT-PCR of 14 of these genes on sorted B-cell progenitors confirmed that the expression of 10 genes is indeed stably established during B-cell differentiation. Review of the published literature of knockout mice revealed that of the predicted genes, 63.4% have defects in B-cell differentiation and function and 22% have a role in the B cell according to other experiments, and the remaining 14.6% are not characterized. Therefore, our method identified novel gene candidates for future examination of their role in B-cell development. These data demonstrate the power of MiDReG in predicting functionally important intermediate genes in a given developmental pathway that is defined by a mutually exclusive gene expression pattern.
Conflict of interest statement
The authors declare no conflict of interest.
Figures
Similar articles
-
Activation-induced cytidine deaminase expression and activity in the absence of germinal centers: insights into hyper-IgM syndrome.J Immunol. 2009 Sep 1;183(5):3237-48. doi: 10.4049/jimmunol.0901548. Epub 2009 Aug 10. J Immunol. 2009. PMID: 19667096 Free PMC article.
-
Regulation of aicda expression and AID activity: relevance to somatic hypermutation and class switch DNA recombination.Crit Rev Immunol. 2007;27(4):367-97. doi: 10.1615/critrevimmunol.v27.i4.60. Crit Rev Immunol. 2007. PMID: 18197815 Free PMC article. Review.
-
Ly6d marks the earliest stage of B-cell specification and identifies the branchpoint between B-cell and T-cell development.Genes Dev. 2009 Oct 15;23(20):2376-81. doi: 10.1101/gad.1836009. Genes Dev. 2009. PMID: 19833765 Free PMC article.
-
Ordering human CD34+CD10-CD19+ pre/pro-B-cell and CD19- common lymphoid progenitor stages in two pro-B-cell development pathways.Proc Natl Acad Sci U S A. 2010 Mar 30;107(13):5925-30. doi: 10.1073/pnas.0907942107. Epub 2010 Mar 15. Proc Natl Acad Sci U S A. 2010. PMID: 20231472 Free PMC article.
-
The First B-Cell Tolerance Checkpoint in Mice and Humans: Control by AID.Adv Immunol. 2018;139:51-92. doi: 10.1016/bs.ai.2018.04.001. Epub 2018 May 7. Adv Immunol. 2018. PMID: 30249334 Review.
Cited by
-
Identification of gene expression logical invariants in Arabidopsis.Plant Direct. 2019 Mar 20;3(3):e00123. doi: 10.1002/pld3.123. eCollection 2019 Mar. Plant Direct. 2019. PMID: 31245766 Free PMC article.
-
GIV/Girdin, a non-receptor modulator for Gαi/s, regulates spatiotemporal signaling during sperm capacitation and is required for male fertility.Elife. 2021 Aug 19;10:e69160. doi: 10.7554/eLife.69160. Elife. 2021. PMID: 34409938 Free PMC article.
-
Network Medicine: New Paradigm in the -Omics Era.Anat Physiol. 2011 Dec 13;1(1):1000e106. doi: 10.4172/2161-0940.1000e106. Anat Physiol. 2011. PMID: 24634802 Free PMC article. No abstract available.
-
Artificial intelligence-rationalized balanced PPARα/γ dual agonism resets dysregulated macrophage processes in inflammatory bowel disease.Commun Biol. 2022 Mar 14;5(1):231. doi: 10.1038/s42003-022-03168-4. Commun Biol. 2022. PMID: 35288651 Free PMC article.
-
Hub Genes in Non-Small Cell Lung Cancer Regulatory Networks.Biomolecules. 2022 Nov 29;12(12):1782. doi: 10.3390/biom12121782. Biomolecules. 2022. PMID: 36551208 Free PMC article.
References
-
- Lee KH, Yu DH, Lee YS. Gene expression profiling of rat cerebral cortex development using cDNA microarrays. Neurochem Res. 2008;34:1030–1038. - PubMed
-
- Jochheim A, et al. Multi-stage analysis of differential gene expression in BALB/C mouse liver development by high-density microarrays. Differentiation. 2003;71:62–72. - PubMed
-
- Master SR, et al. Functional microarray analysis of mammary organogenesis reveals a developmental role in adaptive thermogenesis. Mol Endocrinol. 2002;16:1185–1203. - PubMed
Publication types
MeSH terms
Substances
Grants and funding
- K99 CA151673/CA/NCI NIH HHS/United States
- 5R01AI047458/AI/NIAID NIH HHS/United States
- T32 AI007290/AI/NIAID NIH HHS/United States
- U56 CA112973/CA/NCI NIH HHS/United States
- T32 CA009151/CA/NCI NIH HHS/United States
- R01 AI047458/AI/NIAID NIH HHS/United States
- 5U56CA112973/CA/NCI NIH HHS/United States
- K01 DK078318/DK/NIDDK NIH HHS/United States
- R01 AI047457/AI/NIAID NIH HHS/United States
- 5R01AI047457/AI/NIAID NIH HHS/United States
- K01DK078318/DK/NIDDK NIH HHS/United States
- CA09151/CA/NCI NIH HHS/United States
- T32AI0729022/AI/NIAID NIH HHS/United States
- R01 CA086065/CA/NCI NIH HHS/United States
LinkOut - more resources
Full Text Sources
