

Meta-analysis: excess mortality after hip fracture among older women and men
- PMID: 20231569
- PMCID: PMC3010729
- DOI: 10.7326/0003-4819-152-6-201003160-00008
Meta-analysis: excess mortality after hip fracture among older women and men
Abstract
Background: Although an increased risk for death after hip fracture is well established, whether this excess mortality persists over time is unclear.
Purpose: To determine the magnitude and duration of excess mortality after hip fracture in older men and women.
Data sources: Electronic search of MEDLINE and EMBASE for English and non-English articles from 1957 to May 2009 and manual search of article references.
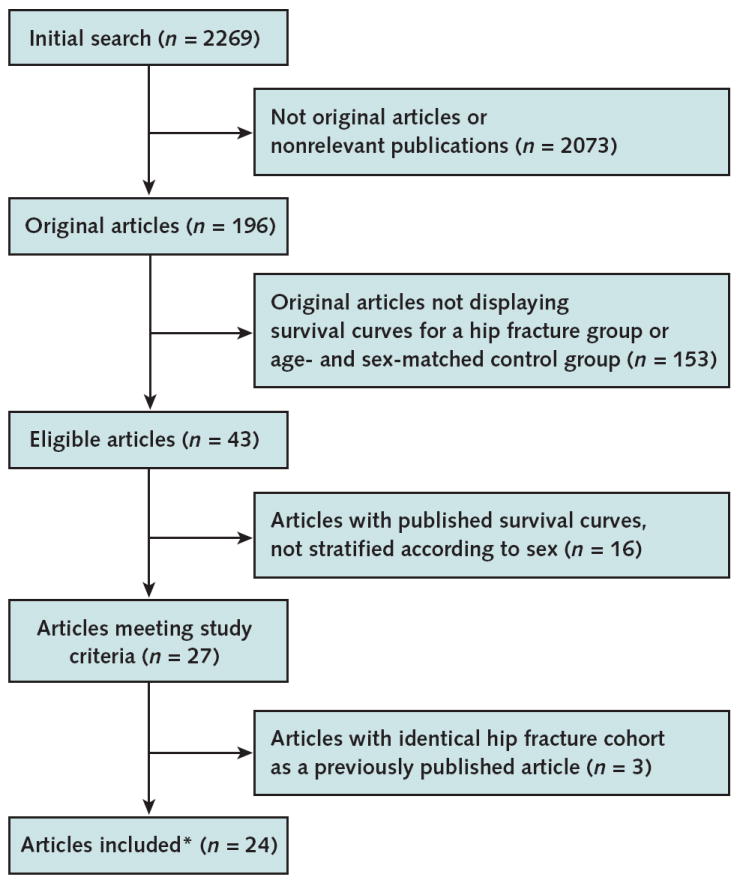
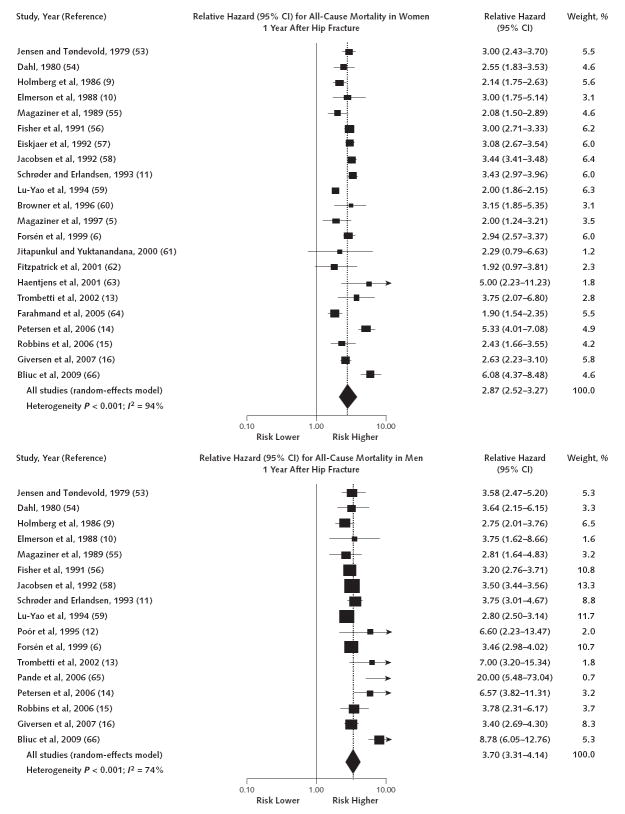
Study selection: Prospective cohort studies were selected by 2 independent reviewers. The studies had to assess mortality in women (22 cohorts) or men (17 cohorts) aged 50 years or older with hip fracture, carry out a life-table analysis, and display the survival curves of the hip fracture group and age- and sex-matched control groups.
Data extraction: Survival curve data and items relevant to study validity and generalizability were independently extracted by 2 reviewers.
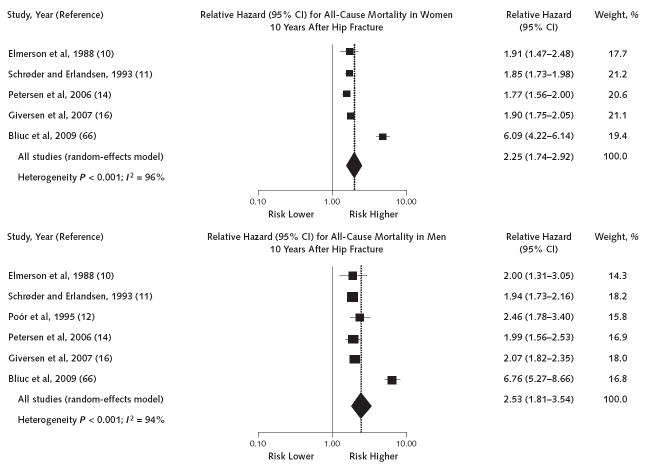
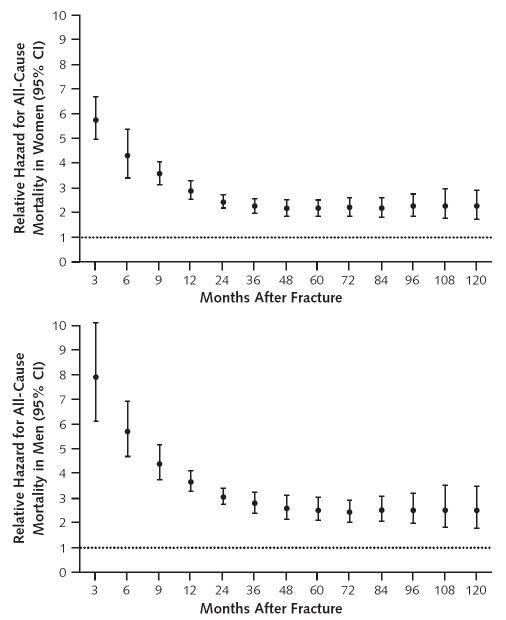
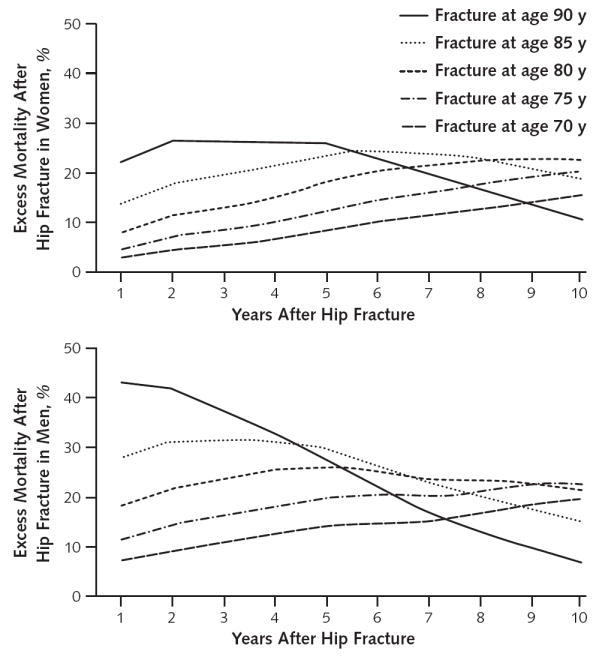
Data synthesis: Time-to-event meta-analyses showed that the relative hazard for all-cause mortality in the first 3 months after hip fracture was 5.75 (95% CI, 4.94 to 6.67) in women and 7.95 (CI, 6.13 to 10.30) in men. Relative hazards decreased substantially over time but did not return to rates seen in age- and sex-matched control groups. Through use of life-table methods, investigators estimated that white women having a hip fracture at age 80 years have excess annual mortality compared with white women of the same age without a fracture of 8%, 11%, 18%, and 22% at 1, 2, 5, and 10 years after injury, respectively. Men with a hip fracture at age 80 years have excess annual mortality of 18%, 22%, 26%, and 20% at 1, 2, 5, and 10 years after injury, respectively.
Limitations: Cohort studies varied, sometimes markedly, in size, duration of observation, selection of control populations, ascertainment of death, and adjustment for comorbid conditions. Only published data that displayed findings with survival curves were examined. Publication bias was possible.
Conclusion: Older adults have a 5- to 8-fold increased risk for all-cause mortality during the first 3 months after hip fracture. Excess annual mortality persists over time for both women and men, but at any given age, excess annual mortality after hip fracture is higher in men than in women.
Primary funding source: Fund for Scientific Research and Willy Gepts Foundation, Universitair Ziekenhuis Brussel.
Conflict of interest statement
Figures
References
-
- Kanis JA, Borgstrom F, Zethraeus N, Johnell O, Oden A, Jönsson B. Intervention thresholds for osteoporosis in the UK. Bone. 2005;36:22–32. - PubMed
-
- Kanis JA, Johnell O, Oden A, Borgstrom F, Johansson H, De Laet C, et al. Intervention thresholds for osteoporosis in men and women: a study based on data from Sweden. Osteoporos Int. 2005;16:6–14. - PubMed
-
- Tosteson AN, Jo¨nsson B, Grima DT, O’Brien BJ, Black DM, Adachi JD. Challenges for model-based economic evaluations of postmenopausal osteoporosis interventions. Osteoporos Int. 2001;12:849–57. - PubMed
Publication types
MeSH terms
Grants and funding
LinkOut - more resources
Full Text Sources
Medical