. 2011 Mar;16(3):273-81.
doi: 10.1038/mp.2010.13. Epub 2010 Mar 16.

Social network determinants of depression

Affiliations

Social network determinants of depression

J N Rosenquist et al. Mol Psychiatry. 2011 Mar.

Erratum in

  • Mol Psychiatry. 2010 Dec;15(12):1197

Abstract

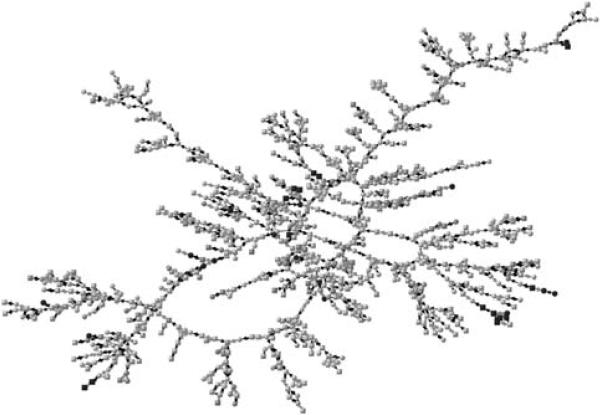
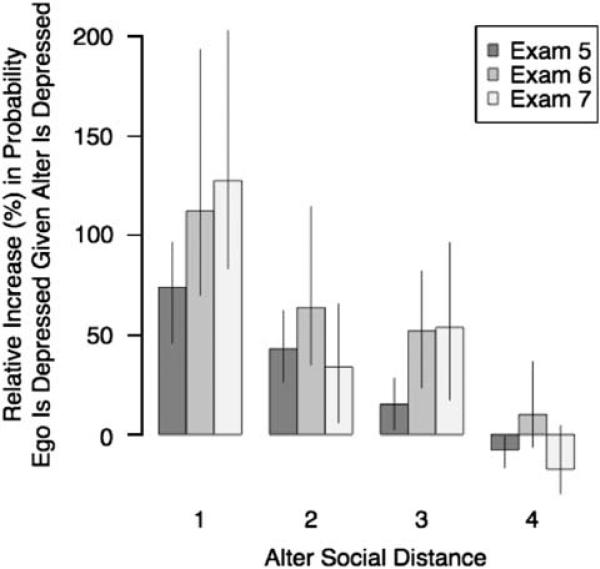
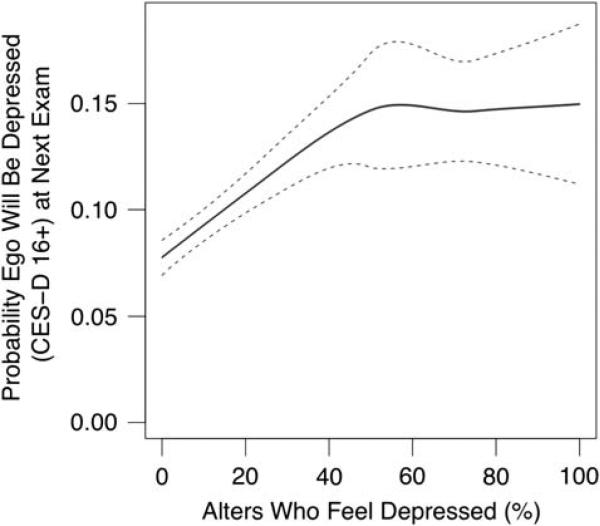
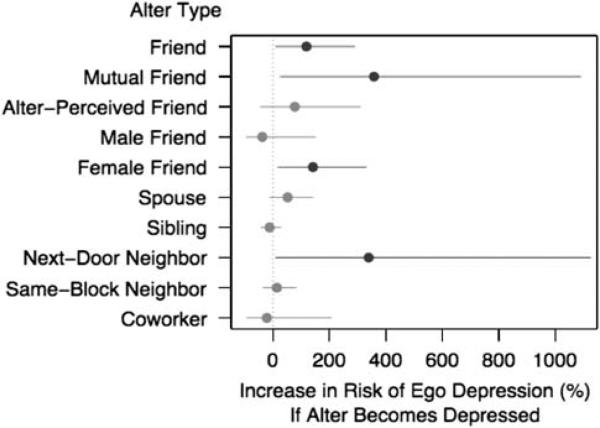
The etiology of depression has long been thought to include social environmental factors. To quantitatively explore the novel possibility of person-to-person spread and network-level determination of depressive symptoms, analyses were performed on a densely interconnected social network of 12,067 people assessed repeatedly over 32 years as part of the Framingham Heart Study. Longitudinal statistical models were used to examine whether depressive symptoms in one person were associated with similar scores in friends, co-workers, siblings, spouses and neighbors. Depressive symptoms were assessed using CES-D scores that were available for subjects in three waves measured between 1983 and 2001. Results showed both low and high CES-D scores (and classification as being depressed) in a given period were strongly correlated with such scores in one's friends and neighbors. This association extended up to three degrees of separation (to one's friends' friends' friends). Female friends appear to be especially influential in the spread of depression from one person to another. The results are robust to multiple network simulation and estimation methods, suggesting that network phenomena appear relevant to the epidemiology of depression and would benefit from further study.


Figures

Figure 1
Figure 1
Depression Clusters in the Framingham Social Network. This graph shows the largest component of friends, spouses and siblings at exam 7 (centered on the year 2000). There are 957 individuals shown. Each node represents a subject and its shape denotes gender (circles are male, squares are female). Lines between nodes indicate relationship (red for siblings, black for friends and spouses). Node color denotes the percentile score of the mean level of depression in ego and all directly connected (distance 1) alters, with yellow being below the 80th percentile, shades of green being the 80th to 95th percentile, and blue being above the 95th percentile (the most depressed).
Figure 2
Figure 2
Social Distance and Depression in the Framingham Social Network. This figure shows for each exam the percentage increase in the likelihood a given ego is depressed if a friend or family member at a certain social distance is depressed (where depressed is defined as a score greater than 16 or greater on the CES-D). Values are derived by comparing the conditional probability of being depressed in the observed network with an identical network (with topology and incidence of depression preserved) in which the same number of depressed subjects are randomly distributed. Alter social distance refers to closest social distance between the alter and ego (alter = distance 1, alter's alter = distance 2, etc.). Error bars show 95% confidence intervals. CES-D, Center for Epidemiological Studies Depression Scale.
Figure 3
Figure 3
Depressed Alters in the Framingham Social Network. This plot shows that the probability of being depressed (CES-D score of 16 or greater) in exams 6 and 7 is positively associated with the fraction of their friends and family in the previous exam who are depressed. Blue line shows smoothed relationship based on bivariate LOESS regression, and dotted lines indicate 95% confidence intervals. CES-D, Center for Epidemiological Studies Depression Scale.
Figure 4
Figure 4
Alter Type and Depression in the Framingham Social Network. This graph shows the change in likelihood of depression given that an alter is depressed. Estimates are based on generalized estimating equation logit models of depression on several different sub-samples of the Framingham Heart Study Social Network. The dependent variable in each model is ego depression status and independent variables include lagged ego depression status, alter depression status, lagged alter depression status, ego age, gender, and education and fixed effects for each wave. Full models and equations are available in the appendix. Mean effect sizes and 95% confidence intervals were calculated by simulating first difference in alter contemporaneous depression status (changing from 0–1) using 1000 randomly drawn sets of estimates from coefficient covariance matrix and assuming all other variables are held at their means.

References

    1. Fava M, Cassano P. Major depressive disorder and dysthymic disorder. In: Stern T, Rosenbaum J, Biederman J, Fava M, Rauch S, editors. The MGH Textbook of Comprehensive Clinical Psychiatry. Mosby-Elsevier; Philadelphia: 2008.
    1. Greenberg PE, Leong SA, Birnbuam HG. Cost of depression: current assessment and future directions. Expert Rev Pharmacoecon Outcomes Res. 2001;1:89–96. - PubMed
    1. Engel GL. The need for a new medical model. Science. 1977;196:129–136. - PubMed
    1. Durkheim E. Suicide. IL. The Free Press; Glencoe: 1951. Translated by John A. Spaulding and George Simpson. Edited with an Introduction by George Simpson. p. 405.
    1. Vilhjalmsson R. Life stress, social support and clinical depression: a reanalysis of the literature. Social Sci Med. 1993;37:331–342. - PubMed

Publication types

Associated data