Widespread gene conversion in centromere cores
- PMID: 20231874
- PMCID: PMC2834711
- DOI: 10.1371/journal.pbio.1000327
Widespread gene conversion in centromere cores
Abstract
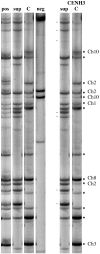
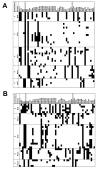
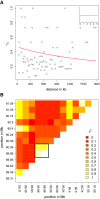
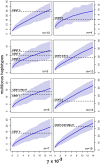
Centromeres are the most dynamic regions of the genome, yet they are typified by little or no crossing over, making it difficult to explain the origin of this diversity. To address this question, we developed a novel CENH3 ChIP display method that maps kinetochore footprints over transposon-rich areas of centromere cores. A high level of polymorphism made it possible to map a total of 238 within-centromere markers using maize recombinant inbred lines. Over half of the markers were shown to interact directly with kinetochores (CENH3) by chromatin immunoprecipitation. Although classical crossing over is fully suppressed across CENH3 domains, two gene conversion events (i.e., non-crossover marker exchanges) were identified in a mapping population. A population genetic analysis of 53 diverse inbreds suggests that historical gene conversion is widespread in maize centromeres, occurring at a rate >1x10(-5)/marker/generation. We conclude that gene conversion accelerates centromere evolution by facilitating sequence exchange among chromosomes.
Conflict of interest statement
The authors have declared that no competing interests exist.
Figures


Similar articles
-
Maize centromere structure and evolution: sequence analysis of centromeres 2 and 5 reveals dynamic Loci shaped primarily by retrotransposons.PLoS Genet. 2009 Nov;5(11):e1000743. doi: 10.1371/journal.pgen.1000743. Epub 2009 Nov 20. PLoS Genet. 2009. PMID: 19956743 Free PMC article.
-
Sequences associated with A chromosome centromeres are present throughout the maize B chromosome.Chromosoma. 2005 Feb;113(7):337-49. doi: 10.1007/s00412-004-0319-z. Epub 2004 Dec 7. Chromosoma. 2005. PMID: 15586285
-
Maize centromeres: organization and functional adaptation in the genetic background of oat.Plant Cell. 2004 Mar;16(3):571-81. doi: 10.1105/tpc.018937. Epub 2004 Feb 18. Plant Cell. 2004. PMID: 14973167 Free PMC article.
-
Dicentric chromosome formation and epigenetics of centromere formation in plants.J Genet Genomics. 2012 Mar 20;39(3):125-30. doi: 10.1016/j.jgg.2012.01.006. Epub 2012 Feb 14. J Genet Genomics. 2012. PMID: 22464471 Review.
-
Centromeric chromatin and its dynamics in plants.Plant J. 2015 Jul;83(1):4-17. doi: 10.1111/tpj.12875. Plant J. 2015. PMID: 25976696 Review.
Cited by
-
Pervasive gene conversion in chromosomal inversion heterozygotes.Mol Ecol. 2019 Mar;28(6):1302-1315. doi: 10.1111/mec.14921. Epub 2018 Dec 10. Mol Ecol. 2019. PMID: 30387889 Free PMC article.
-
A centromere satellite concomitant with extensive karyotypic diversity across the Peromyscus genus defies predictions of molecular drive.Chromosome Res. 2019 Sep;27(3):237-252. doi: 10.1007/s10577-019-09605-1. Epub 2019 Feb 15. Chromosome Res. 2019. PMID: 30771198 Free PMC article.
-
The Evolutionary Fates of a Large Segmental Duplication in Mouse.Genetics. 2016 Sep;204(1):267-85. doi: 10.1534/genetics.116.191007. Epub 2016 Jul 2. Genetics. 2016. PMID: 27371833 Free PMC article.
-
High Quality Maize Centromere 10 Sequence Reveals Evidence of Frequent Recombination Events.Front Plant Sci. 2016 Mar 23;7:308. doi: 10.3389/fpls.2016.00308. eCollection 2016. Front Plant Sci. 2016. PMID: 27047500 Free PMC article.
-
Total centromere size and genome size are strongly correlated in ten grass species.Chromosome Res. 2012 May;20(4):403-12. doi: 10.1007/s10577-012-9284-1. Epub 2012 May 3. Chromosome Res. 2012. PMID: 22552915 Free PMC article.
References
-
- Murphy W. J, Larkin D. M, Everts-van der Wind A, Bourque G, Tesler G, et al. Dynamics of mammalian chromosome evolution inferred from multispecies comparative maps. Science. 2005;309:613–617. - PubMed
-
- O'Neill R. J, Eldridge M. D, Metcalfe C. J. Centromere dynamics and chromosome evolution in marsupials. J Hered. 2004;95:375–381. - PubMed
-
- Henikoff S, Ahmad K, Malik H. S. The centromere paradox: stable inheritance with rapidly evolving DNA. Science. 2001;293:1098–1102. - PubMed
-
- Smith G. P. Evolution of repeated DNA sequences by unequal crossover. Science. 1976;191:528–535. - PubMed

