

Fumarase: a mitochondrial metabolic enzyme and a cytosolic/nuclear component of the DNA damage response
- PMID: 20231875
- PMCID: PMC2834712
- DOI: 10.1371/journal.pbio.1000328
Fumarase: a mitochondrial metabolic enzyme and a cytosolic/nuclear component of the DNA damage response
Abstract
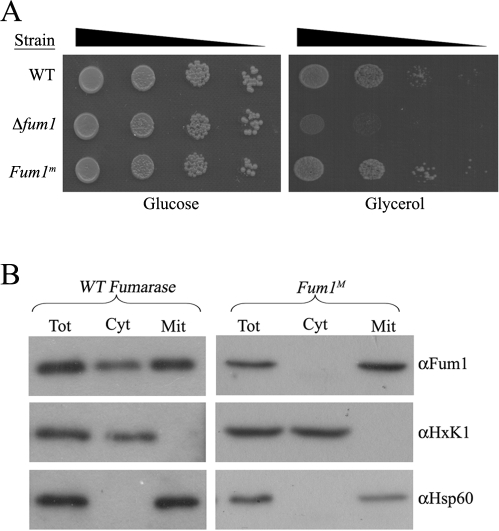
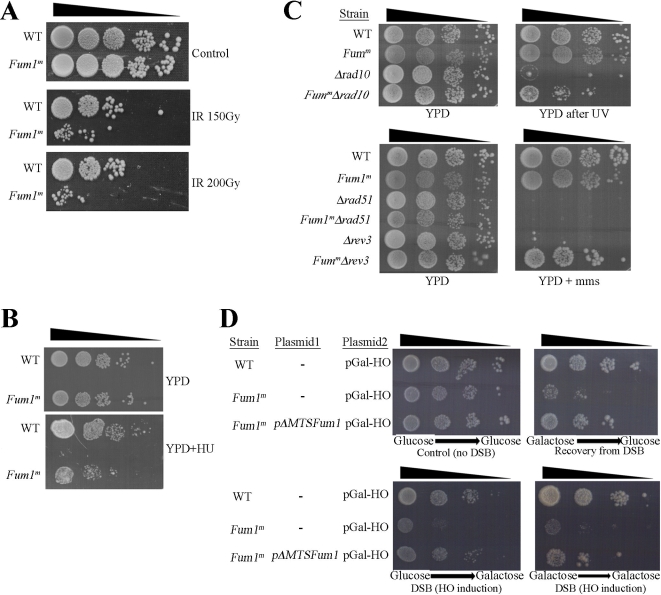
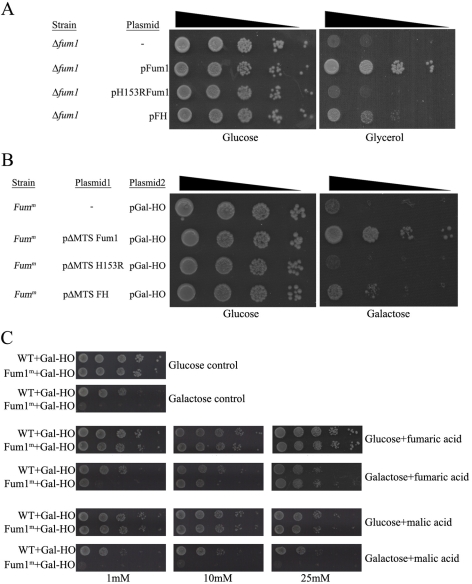
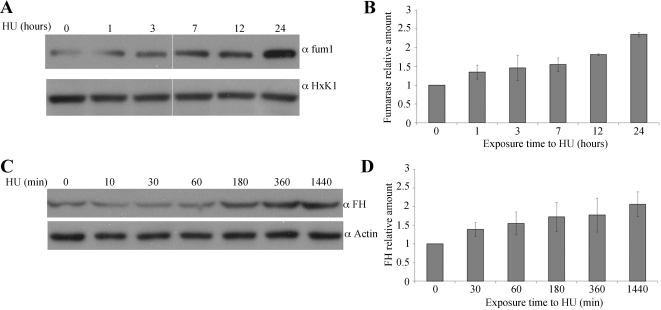
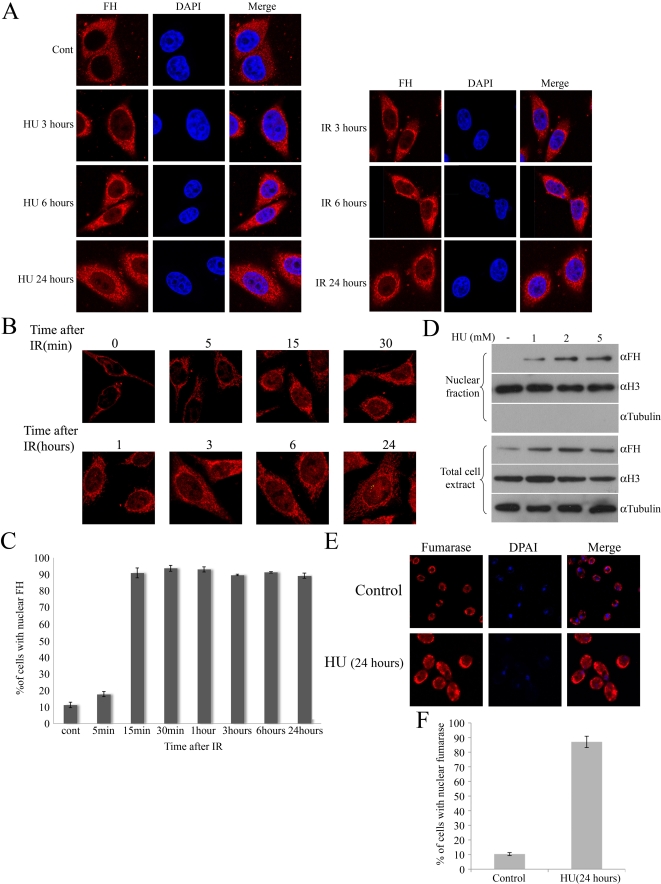
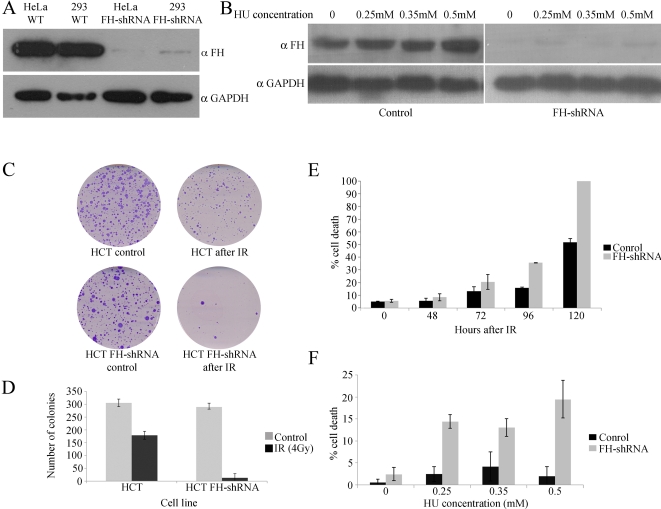
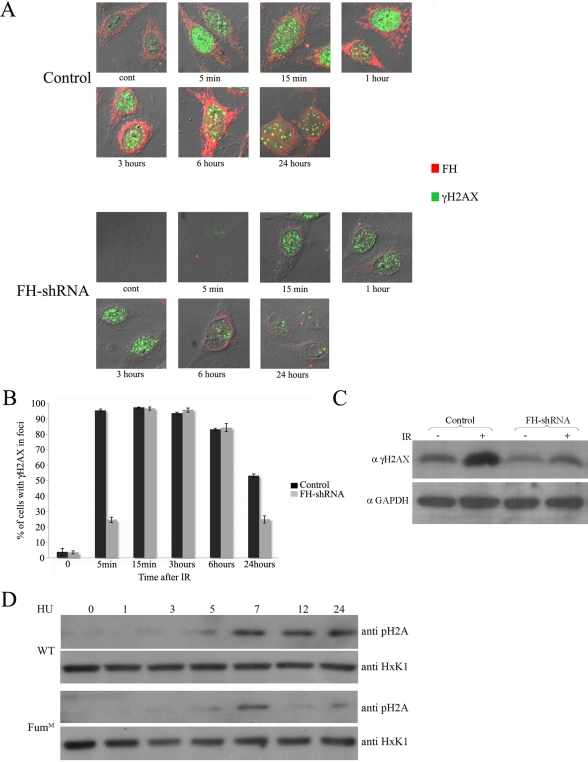
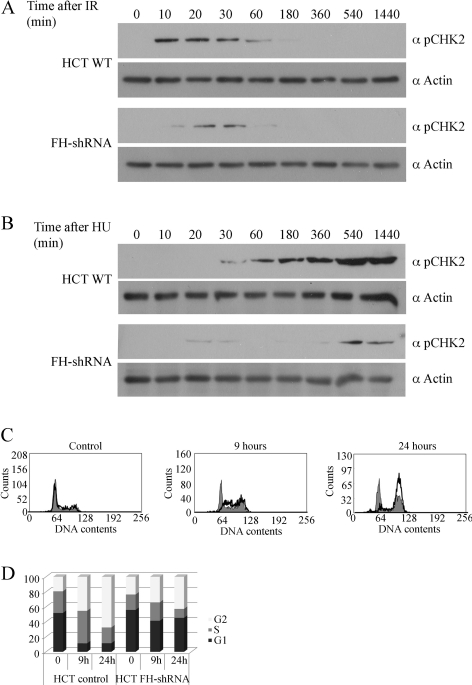
In eukaryotes, fumarase (FH in human) is a well-known tricarboxylic-acid-cycle enzyme in the mitochondrial matrix. However, conserved from yeast to humans is a cytosolic isoenzyme of fumarase whose function in this compartment remains obscure. A few years ago, FH was surprisingly shown to underlie a tumor susceptibility syndrome, Hereditary Leiomyomatosis and Renal Cell Cancer (HLRCC). A biallelic inactivation of FH has been detected in almost all HLRCC tumors, and therefore FH was suggested to function as a tumor suppressor. Recently it was suggested that FH inhibition leads to elevated intracellular fumarate, which in turn acts as a competitive inhibitor of HPH (HIF prolyl hydroxylase), thereby causing stabilization of HIF (Hypoxia-inducible factor) by preventing proteasomal degradation. The transcription factor HIF increases the expression of angiogenesis regulated genes, such as VEGF, which can lead to high microvessel density and tumorigenesis. Yet this mechanism does not fully explain the large cytosolic population of fumarase molecules. We constructed a yeast strain in which fumarase is localized exclusively to mitochondria. This led to the discovery that the yeast cytosolic fumarase plays a key role in the protection of cells from DNA damage, particularly from DNA double-strand breaks. We show that the cytosolic fumarase is a member of the DNA damage response that is recruited from the cytosol to the nucleus upon DNA damage induction. This function of fumarase depends on its enzymatic activity, and its absence in cells can be complemented by high concentrations of fumaric acid. Our findings suggest that fumarase and fumaric acid are critical elements of the DNA damage response, which underlies the tumor suppressor role of fumarase in human cells and which is most probably HIF independent. This study shows an exciting crosstalk between primary metabolism and the DNA damage response, thereby providing a scenario for metabolic control of tumor propagation.
Conflict of interest statement
The authors have declared that no competing interests exist.
Figures
Similar articles
-
HIF overexpression correlates with biallelic loss of fumarate hydratase in renal cancer: novel role of fumarate in regulation of HIF stability.Cancer Cell. 2005 Aug;8(2):143-53. doi: 10.1016/j.ccr.2005.06.017. Cancer Cell. 2005. PMID: 16098467
-
Cells lacking the fumarase tumor suppressor are protected from apoptosis through a hypoxia-inducible factor-independent, AMPK-dependent mechanism.Mol Cell Biol. 2012 Aug;32(15):3081-94. doi: 10.1128/MCB.06160-11. Epub 2012 May 29. Mol Cell Biol. 2012. PMID: 22645311 Free PMC article.
-
Human Fumarate Hydratase Is Dual Localized by an Alternative Transcription Initiation Mechanism.Traffic. 2016 Jul;17(7):720-32. doi: 10.1111/tra.12397. Epub 2016 May 6. Traffic. 2016. PMID: 27037871
-
Fumarate hydratase inactivation in renal tumors: HIF1α, NRF2, and "cryptic targets" of transcription factors.Chin J Cancer. 2012 Sep;31(9):413-20. doi: 10.5732/cjc.012.10102. Epub 2012 Jul 2. Chin J Cancer. 2012. PMID: 22776233 Free PMC article. Review.
-
Fumarase: a paradigm of dual targeting and dual localized functions.FEBS J. 2011 Nov;278(22):4230-42. doi: 10.1111/j.1742-4658.2011.08359.x. Epub 2011 Oct 24. FEBS J. 2011. PMID: 21929734 Review.
Cited by
-
Cell Metabolism and DNA Repair Pathways: Implications for Cancer Therapy.Front Cell Dev Biol. 2021 Mar 23;9:633305. doi: 10.3389/fcell.2021.633305. eCollection 2021. Front Cell Dev Biol. 2021. PMID: 33834022 Free PMC article. Review.
-
Crystal structure of an Fe-S cluster-containing fumarate hydratase enzyme from Leishmania major reveals a unique protein fold.Proc Natl Acad Sci U S A. 2016 Aug 30;113(35):9804-9. doi: 10.1073/pnas.1605031113. Epub 2016 Aug 15. Proc Natl Acad Sci U S A. 2016. PMID: 27528683 Free PMC article.
-
Partitioning of Respiration in an Animal-Algal Symbiosis: Implications for Different Aerobic Capacity between Symbiodinium spp.Front Physiol. 2016 Apr 18;7:128. doi: 10.3389/fphys.2016.00128. eCollection 2016. Front Physiol. 2016. PMID: 27148067 Free PMC article.
-
Multiple proteins with essential mitochondrial functions have glycosylated isoforms.Mitochondrion. 2012 Jul;12(4):423-7. doi: 10.1016/j.mito.2012.04.004. Epub 2012 May 4. Mitochondrion. 2012. PMID: 22564751 Free PMC article.
-
Biolistic Transformation of Chlamydomonas reinhardtii and Saccharomyces cerevisiae Mitochondria.Methods Mol Biol. 2023;2615:345-364. doi: 10.1007/978-1-0716-2922-2_24. Methods Mol Biol. 2023. PMID: 36807803
References
-
- Akiba T, Hiraga K, Tuboi S. Intracellular distribution of fumarase in various animals. J Biochem. 1984;96:189–195. - PubMed
-
- Tuboi S, Suzuki T, Sato M, Yoshida T. Rat liver mitochondrial and cytosolic fumarases with identical amino acid sequences are encoded from a single mRNA with two alternative in-phase AUG initiation sites. Adv Enzyme Regul. 1990;30:289–304. - PubMed
-
- Ratner S, Anslow W. P, Jr, Petrack B. Biosynthesis of urea. VI. Enzymatic cleavage of argininosuccinic acid to arginine and fumaric acid. J Biol Chem. 1953;204:115–125. - PubMed
-
- Ravdin R. G, Crandall D. I. The enzymatic conversion of homogentisic acid to 4-fumarylacetoacetic acid. J Biol Chem. 1951;189:137–149. - PubMed
Publication types
MeSH terms
Substances
Grants and funding
LinkOut - more resources
Full Text Sources
Molecular Biology Databases
Miscellaneous
