

A GIP receptor agonist exhibits beta-cell anti-apoptotic actions in rat models of diabetes resulting in improved beta-cell function and glycemic control
- PMID: 20231880
- PMCID: PMC2834736
- DOI: 10.1371/journal.pone.0009590
A GIP receptor agonist exhibits beta-cell anti-apoptotic actions in rat models of diabetes resulting in improved beta-cell function and glycemic control
Abstract
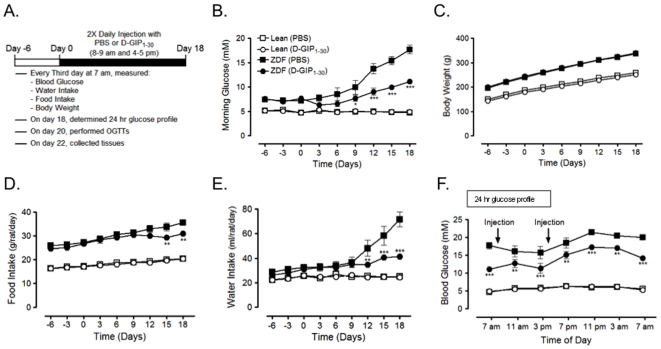
Aims: The gastrointestinal hormone GIP promotes pancreatic islet function and exerts pro-survival actions on cultured beta-cells. However, GIP also promotes lipogenesis, thus potentially restricting its therapeutic use. The current studies evaluated the effects of a truncated GIP analog, D-Ala(2)-GIP(1-30) (D-GIP(1-30)), on glucose homeostasis and beta-cell mass in rat models of diabetes.
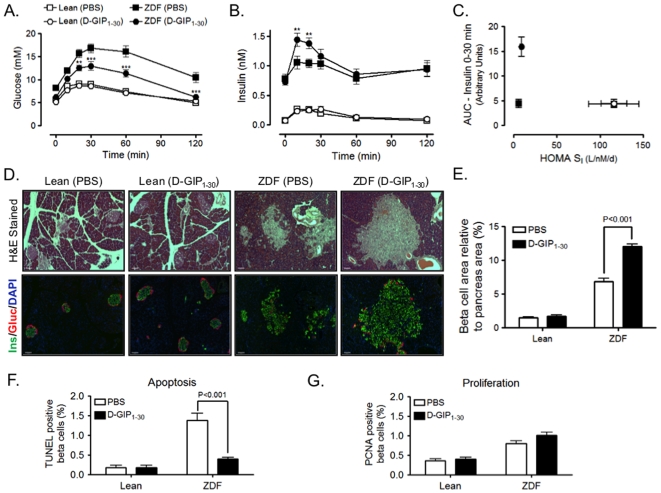
Materials and methods: The insulinotropic and pro-survival potency of D-GIP(1-30) was evaluated in perfused pancreas preparations and cultured INS-1 beta-cells, respectively, and receptor selectivity evaluated using wild type and GIP receptor knockout mice. Effects of D-GIP(1-30) on beta-cell function and glucose homeostasis, in vivo, were determined using Lean Zucker rats, obese Vancouver diabetic fatty rats, streptozotocin treated rats, and obese Zucker diabetic fatty rats, with effects on beta-cell mass determined in histological studies of pancreatic tissue. Lipogenic effects of D-GIP(1-30) were evaluated on cultured 3T3-L1 adipocytes.
Results: Acutely, D-GIP(1-30) improved glucose tolerance and insulin secretion. Chronic treatment with D-GIP(1-30) reduced levels of islet pro-apoptotic proteins in Vancouver diabetic fatty rats and preserved beta-cell mass in streptozotocin treated rats and Zucker diabetic fatty rats, resulting in improved insulin responses and glycemic control in each animal model, with no change in body weight. In in vitro studies, D-GIP(1-30) exhibited equivalent potency to GIP(1-42) on beta-cell function and survival, but greatly reduced action on lipoprotein lipase activity in 3T3-L1 adipocytes.
Conclusions: These findings demonstrate that truncated forms of GIP exhibit potent anti-diabetic actions, without pro-obesity effects, and that the C-terminus contributes to the lipogenic actions of GIP.
Conflict of interest statement
Figures


Similar articles
-
Defective glucose-dependent insulinotropic polypeptide receptor expression in diabetic fatty Zucker rats.Diabetes. 2001 May;50(5):1004-11. doi: 10.2337/diabetes.50.5.1004. Diabetes. 2001. PMID: 11334402
-
Dipeptidyl peptidase IV-resistant [D-Ala(2)]glucose-dependent insulinotropic polypeptide (GIP) improves glucose tolerance in normal and obese diabetic rats.Diabetes. 2002 Mar;51(3):652-61. doi: 10.2337/diabetes.51.3.652. Diabetes. 2002. PMID: 11872663
-
A novel long-acting glucose-dependent insulinotropic peptide analogue: enhanced efficacy in normal and diabetic rodents.Diabetes Obes Metab. 2014 Jan;16(1):75-85. doi: 10.1111/dom.12181. Epub 2013 Aug 19. Diabetes Obes Metab. 2014. PMID: 23859463 Free PMC article.
-
Glucose-dependent Insulinotropic Polypeptide (GIP): From prohormone to actions in endocrine pancreas and adipose tissue.Dan Med Bull. 2011 Dec;58(12):B4368. Dan Med Bull. 2011. PMID: 22142579 Review.
-
Inhibition of glucagon secretion.Adv Pharmacol. 2005;52:151-71. doi: 10.1016/S1054-3589(05)52008-8. Adv Pharmacol. 2005. PMID: 16492545 Review.
Cited by
-
Gastric inhibitory peptide controls adipose insulin sensitivity via activation of cAMP-response element-binding protein and p110β isoform of phosphatidylinositol 3-kinase.J Biol Chem. 2011 Dec 16;286(50):43062-70. doi: 10.1074/jbc.M111.289009. Epub 2011 Oct 25. J Biol Chem. 2011. PMID: 22027830 Free PMC article.
-
Discovery of dual-action membrane-anchored modulators of incretin receptors.PLoS One. 2011;6(9):e24693. doi: 10.1371/journal.pone.0024693. Epub 2011 Sep 14. PLoS One. 2011. PMID: 21935440 Free PMC article.
-
Exenatide induces frataxin expression and improves mitochondrial function in Friedreich ataxia.JCI Insight. 2020 Jan 30;5(2):e134221. doi: 10.1172/jci.insight.134221. JCI Insight. 2020. PMID: 31877117 Free PMC article.
-
Comparative Effects of GLP-1 and GLP-2 on Beta-Cell Function, Glucose Homeostasis and Appetite Regulation.Biomolecules. 2024 Nov 27;14(12):1520. doi: 10.3390/biom14121520. Biomolecules. 2024. PMID: 39766228 Free PMC article.
-
Gut Hormones and Inflammatory Bowel Disease.Biomolecules. 2025 Jul 14;15(7):1013. doi: 10.3390/biom15071013. Biomolecules. 2025. PMID: 40723884 Free PMC article. Review.
References
-
- Kahn SE. The relative contributions of insulin resistance and beta-cell dysfunction to the pathophysiology of Type 2 diabetes. Diabetologia. 2003;46:3–19. - PubMed
-
- Abdul-Ghani MA, DeFronzo RA. Pathophysiology of prediabetes. Curr Diab Rep. 2009;9:193–199. - PubMed
-
- Butler AE, Janson J, Bonner-Weir S, Ritzel R, Rizza RA, et al. Beta-cell deficit and increased beta-cell apoptosis in humans with type 2 diabetes. Diabetes. 2003;52:102–110. - PubMed
Publication types
MeSH terms
Substances
Grants and funding
LinkOut - more resources
Full Text Sources
Other Literature Sources
