. 2010 Mar 9;5(3):e9600.
doi: 10.1371/journal.pone.0009600.

Phospholipase D1 mediates AMP-activated protein kinase signaling for glucose uptake

Affiliations

Phospholipase D1 mediates AMP-activated protein kinase signaling for glucose uptake

Jong Hyun Kim et al. PLoS One. .

Abstract

Background: Glucose homeostasis is maintained by a balance between hepatic glucose production and peripheral glucose utilization. In skeletal muscle cells, glucose utilization is primarily regulated by glucose uptake. Deprivation of cellular energy induces the activation of regulatory proteins and thus glucose uptake. AMP-activated protein kinase (AMPK) is known to play a significant role in the regulation of energy balances. However, the mechanisms related to the AMPK-mediated control of glucose uptake have yet to be elucidated.

Methodology/principal findings: Here, we found that AMPK-induced phospholipase D1 (PLD1) activation is required for (14)C-glucose uptake in muscle cells under glucose deprivation conditions. PLD1 activity rather than PLD2 activity is significantly enhanced by glucose deprivation. AMPK-wild type (WT) stimulates PLD activity, while AMPK-dominant negative (DN) inhibits it. AMPK regulates PLD1 activity through phosphorylation of the Ser-505 and this phosphorylation is increased by the presence of AMP. Furthermore, PLD1-S505Q, a phosphorylation-deficient mutant, shows no changes in activity in response to glucose deprivation and does not show a significant increase in (14)C-glucose uptake when compared to PLD1-WT. Taken together, these results suggest that phosphorylation of PLD1 is important for the regulation of (14)C-glucose uptake. In addition, extracellular signal-regulated kinase (ERK) is stimulated by AMPK-induced PLD1 activation through the formation of phosphatidic acid (PA), which is a product of PLD. An ERK pharmacological inhibitor, PD98059, and the PLD inhibitor, 1-BtOH, both attenuate (14)C-glucose uptake in muscle cells. Finally, the extracellular stresses caused by glucose deprivation or aminoimidazole carboxamide ribonucleotide (AICAR; AMPK activator) regulate (14)C-glucose uptake and cell surface glucose transport (GLUT) 4 through ERK stimulation by AMPK-mediated PLD1 activation.

Conclusions/significance: These results suggest that AMPK-mediated PLD1 activation is required for (14)C-glucose uptake through ERK stimulation. We propose that the AMPK-mediated PLD1 pathway may provide crucial clues to understanding the mechanisms involved in glucose uptake.


Conflict of interest statement

Competing Interests: The authors have declared that no competing interests exist.

Figures

Figure 1
Figure 1. The effects of glucose deprivation on PLD activity.
A. HEK-293 cells were transfected with the indicated plasmids for vector, PLD1 or PLD2. At 40 h after transfection, cells were incubated in glucose free-DMEM with or without 25 mM glucose for 2 h. Cells were then labeled with [3H]myristric acid for 4 h and the formation of [3H]PBtOH was quantified as described in the materials and methods. Quantitative data represent the means of three independent experiments. *, p<0.05 versus vector-transfected cells with glucose; #, p<0.05 versus vector-transfected cells without glucose. B. HEK-293 cells were transfected with siRNAs for PLD1, PLD2 or control (Luciferase). At 40 h after transfection, cells were incubated in glucose free-DMEM with the indicated concentrations of glucose (25 mM [4.5 g/L], 12.5 mM [2.25 g/L], 6.25 mM [1.125 g/L]) for 2 h. Cells were then labeled with [3H]myristric acid for 4 h and the formation of [3H]PBtOH was quantified. The expression levels of PLD and AMPK were analyzed by western blotting using antibodies directed against PLDs or AMPK. pACC (Ser-79) and pAMPK (Thr-172) were used as positive controls to show the activation of AMPK pathway induced by glucose deprivation. Actin was used as a loading control. Quantitative data represent the means of three independent experiments. *, p<0.05 versus control siRNA-transfected cells in the presence of glucose; #, p<0.05 versus control siRNA-transfected cells in the absence of glucose. C. HEK-293 cells were infected with control (empty vector), AMPK-WT or AMPK-DN adenovirus. At 40 h after infection, cells were incubated in glucose free-DMEM with or without 25 mM glucose for 2 h. Cells were labeled with [3H]myristric acid for 4 h and the formation of [3H]PBtOH was then quantified. Data represent the means of three independent experiments. *, p<0.05 versus control adenovirus-infected cells with glucose; #, p<0.05 versus control adenovirus-infected cells without glucose.
Figure 2
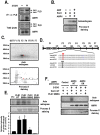
Figure 2. AMPK phosphorylates PLD1 but not PLD2.
A. After treatment with 25 mM 2-DOG for 10 min, HEK-293 cells were lysed with buffer containing 1% Triton X-100 and 1% cholic acid. After determination of the total protein concentrations, equal amounts of extracts were immunoprecipitated with anti-PLD antibody. After brief centrifugation and washing, the precipitates were subjected to SDS-PAGE and immunoblotted with anti-PLD and anti-AMPK antibodies. The total lysates show approximately 1% of the proteins used for immunoprecipitation. B. AMPK was incubated with purified PLD1 (100 ng) in kinase buffer A (50 mM Tris/HCl, pH 7.4, 1 mM dithiothreitol, 0.02% Brij-35 and 10 µCi of [γ-32P]ATP (3,000 Ci/mmol)) in the presence or absence of AMP (200 nM). This reaction was terminated by the addition of SDS sample buffer. The precipitates were then subjected to SDS-PAGE and exposed to photographic film for autoradiography. Ponceau S staining shows the protein amounts in each sample. C. GST-truncated PLD1 fusion mutants were expressed in bacteria and then purified using glutathione sepharose beads. The truncated PLD1 mutants were followed by F1 (amino acid [a.a.] 1 to 331), F2 (a.a. 332 to 498), F3 (a.a. 499 to 604), F4 (a.a. 605 to 712), F5 (a.a. 713 to 825), F6 (a.a. 826 to 927) and F7 (a.a. 928 to 1036). AMPK was incubated with an equal amount of each GST-truncated PLD1 fusion mutants (1 µg) in kinase buffer A in the presence of AMP (200 nM). This reaction was terminated by the addition of SDS sample buffer and exposed to photographic film for autoradiography. D. Schematic diagram of the PLD1 sequences. Human PLD1 sequences corresponding to the loop region were aligned with those of rat and mouse. Candidate phosphorylation sites of PLD1 for AMPK are shown in the boxes. E. HEK-293 cells were transfected with the indicated plasmids for vector, PLD1-WT, S558A, S505Q or S505A. At 48 h after transfection, cells were lysed with buffer and the lysates were immunoprecipitated with anti-PLD antibody. After brief centrifugation and washing, AMPK was incubated with the PLD1-immunocomplexes in kinase buffer A. This reaction was terminated by the addition of SDS sample buffer and the precipitates were then subjected to SDS-PAGE and exposed to photographic film for autoradiography. The relative intensity of the autoradiogram was quantified as described in the materials and methods. The data shown represent one of three independent experiments. Bar graphs reflect the average of three independent experiments. *, p<0.05 versus vector-transfected cells. F. HEK-293 cells were transfected with the indicated plasmids of PLD1-WT or PLD1-S505Q. At 24 h post-transfection, cells were infected with control (empty vector), AMPK-WT or AMPK-DN adenovirus. At 24 h after infection, cells were loaded with [32P] orthophosphate (3 mCi/ml) for 5 h and then treated with 25 mM of 2-DOG for 10 min. Next, the extracts were prepared with lysis buffer and immunoprecipitated with anti-PLD antibody. After brief centrifugation and washing, the precipitates were then subjected to SDS-PAGE, transferred to nitrocellulose membranes and exposed to photographic film for autoradiography. The expression levels of AMPK and PLD1 were analyzed by western blotting and ponceau S staining. Data represent one of three independent experiments.
Figure 3
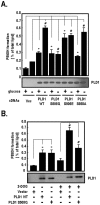
Figure 3. Activity of PLD1-WT and PLD1-mutants under glucose deprivation.
A. HEK-293 cells were transfected with the indicated plasmids of vector, PLD1-WT, S558A, S505Q or S505E. At 40 h after transfection, cells were incubated in glucose free-DMEM with or without 25 mM glucose for 2 h. PLD activity in each group was then measured by the formation of [3H]PBtOH. The expression levels of PLD1 were analyzed by western blotting. Quantitative data represent the means of four independent experiments. *, p<0.01 versus vector-transfected cells with glucose; #, p<0.01 versus vector-transfected cells without glucose. B. HEK-293 cells were transfected with siRNAs directed against PLD. At 24 h post-transfection, cells were transfected with siRNA-resistant forms of the indicated PLD1 . After 24 h, cells were treated with 25 mM of 2-DOG for 10 min and the formation of [3H]PBtOH was then quantified as previously described. Re-expression levels of PLD1 were analyzed by western blotting. Quantitative data represent the means of three independent experiments. *, p<0.01 versus vector-transfected cells without 2-DOG; #, p<0.01 versus vector-transfected cells with 2-DOG.
Figure 4
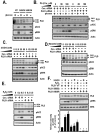
Figure 4. The effects of PLD1 on ERK activation by various stimuli.
A. After HEK-293 cells were incubated in glucose free-DMEM with or without 25 mM glucose for 2 h, cells were treated with 1-BtOH or t-BtOH for 15 min and then lysed with lysis buffer. Cell lysates were then analyzed by western blotting with the indicated antibodies. pACC (Ser-79) was used as a positive control to show the activation of AMPK pathway induced by glucose deprivation. Actin was used as a loading control. These data represent the mean of three independent analyses. B. HEK-293 cells were transfected with the indicated siRNAs of control (Luciferase) or PLD1. At 48 h after transfection, cells were incubated in glucose free-DMEM with or without 25 mM glucose and the indicated concentrations of exogenous PA for 2 h. Cells were harvested and then lysed with lysis buffer. pACC (Ser-79) was used as a positive control and the protein amounts were normalized against actin. Cell lysates were subjected to SDS-PAGE and analyzed by western blotting with the indicated antibodies. These data represent one of three experiments in independent analyses. C. HEK-293 cells were transfected with the indicated siRNAs of control (Luciferase) or PLD1. At 48 h after transfection, cells were treated with the indicated concentrations of 2-DOG for 10 min. Then, cells were lysed with lysis buffer and lysates were subjected to SDS-PAGE and then immunoblotted with the indicated antibodies. pACC (Ser-79) was used as a positive control to show the activation of the AMPK pathway induced by treatment with 2-DOG. Actin was used as a loading control for western blotting. The data shown represent one of three independent experiments. D. HEK-293 cells were transfected with the indicated siRNAs for control (Luciferase) or PLD1. At 48 h after transfection, cells were treated with the indicated concentrations of mannitol as a negative control to induce hyperosmolar stress for 10 min. Cells were prepared according to the methods described in panel A and cell lysates were then immunoblotted with the indicated antibodies. These data shown are from one of three independent experiments. E. HEK-293 cells were transfected with the indicated siRNAs of control (Luciferase) or PLD1. At 48 h after transfection, cells were treated with the indicated concentrations of H2O2 for 10 min as a positive control to induce oxidative stress. Cells were prepared according to the methods described in panel A and cells lysates were then immunoblotted with the indicated antibodies. pACC (Ser-79) was used as a positive control to show the activation of the AMPK pathway induced by H2O2 treatment. Actin was used as a loading control for western blotting. These data shown are from one of three independent experiments. F. HEK-293 cells were transfected with the indicated plasmids for PLD1-WT, PLD1-S505Q or PLD1-K860R. At 48 h after transfection, cells were treated with 25 mM of 2-DOG or 0.2 mM of H2O2 for 10 min. Cell lysates were prepared as described in A and then immunoblotted with the indicated antibodies. pERK activation was normalized against the expression of ERK. The relative intensity of pERK was quantified as described in the materials and methods. The data shown represent one of three independent experiments. Bar graphs reflect the average of three independent experiments. *, p<0.05 versus PLD1-WT-transfected cells.
Figure 5
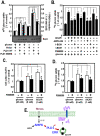
Figure 5. Glucose uptake in differentiated C2C12 and L6 GLUT4-myc myotube cells.
A. C2C12 cells were transfected with PLD siRNAs. At 24 after transfection, cells were transfected with the indicated siRNA-resistant PLD1 plasmids for vector, PLD1-WT or PLD1-S505Q . After 24 h, cells were incubated in glucose free-DMEM with or without 25 mM glucose for 2 h. The expression levels of PLD1 were then analyzed by western blotting. The amounts of 14C-glucose uptake and [3H]PBtOH formation were analyzed as described in the materials and methods. The quantitative data shown represent the means of three independent experiments. *, #, p<0.05 versus vector-transfected cells with glucose; ¶, §, p<0.05 versus vector-transfected cells without glucose. B. After C2C12 cells were differentiated according to the procedures described in the materials and methods, cells were incubated in glucose free-DMEM with or without 25 mM glucose for 2 h. Cells were then treated with the indicated exogenous agents (AICAR [1 mM], 1-BtOH [0.4%], t-BtOH [0.4%], PD98059 [20 µM]) for 30 min. For the case of infection of AMPK-DN adenovirus, the differentiated C2C12 cells were incubated with the virus for 48 h. Cells were then incubated in glucose free-DMEM with or without 25 mM glucose for 2 h and were treated with 1 mM of AICAR for 15 min. The uptake of 14C-glucose was measured and quantified. The quantitative data shown represent the means of four independent experiments. *, p<0.05 versus vehicle treatment in the presence of glucose; #, p<0.05 versus vehicle treatment in the absence of glucose. C. L6 GLUT4-myc myoblast cells were differentiated according to the procedures described in the materials and methods. The differentiated L6 GLUT4-myc myotube cells were incubated in glucose free-DMEM with or without 25 mM glucose for 2 h or pre-treated with 1 mM AICAR for 30 min. After treatment with 20 µM of PD98059 for 30 min, the amount of cell surface GLUT4 was quantified as described in the materials and methods. This experiment was performed as three independent assays. *, p<0.01 versus vehicle treatment in the presence of 25 mM glucose; #, p<0.01 versus PD98059 treatment in the presence of 25 mM glucose. D. The differentiated L6 GLUT4-myc myotube cells were incubated in glucose free-DMEM with or without 25 mM glucose for 2 h or pre-treated with 1 mM AICAR for 30 min. After treatment with 20 µM of PD98059 for 30 min, the uptake of 14C-glucose was measured and quantified. Quantitative data represent the means of three independent experiments. *, p<0.01 versus vehicle treatment in the presence of 25 mM glucose; #, p<0.01 versus PD98059 treatment in the presence of 25 mM glucose. E. A hypothetical model. This diagram shows a hypothetical model of extracellular stress-mediated glucose uptake. Glucose uptake is induced by the AMPK-activated signaling pathway. In this pathway, AMPK increases PLD1 activity through phosphorylation and promotes glucose uptake by triggering subsequent ERK activation in muscle cells.

Similar articles

Cited by

References

    1. Barnes BR, Zierath JR. Role of AMP–activated protein kinase in the control of glucose homeostasis. Curr Mol Med. 2005;5:341–348. - PubMed
    1. Kahn BB, Alquier T, Carling D, Hardie DG. AMP-activated protein kinase: ancient energy gauge provides clues to modern understanding of metabolism. Cell Metab. 2005;1:15–25. - PubMed
    1. Musi N, Yu H, Goodyear LJ. AMP-activated protein kinase regulation and action in skeletal muscle during exercise. Biochem Soc Trans. 2003;31:191–195. - PubMed
    1. Itani SI, Saha AK, Kurowski TG, Coffin HR, Tornheim K, et al. Glucose autoregulates its uptake in skeletal muscle: involvement of AMP-activated protein kinase. Diabetes. 2003;52:1635–1640. - PubMed
    1. Mu J, Jr, Brozinick JT, Valladaress O, Bucan M, Birnbaum MJ. A role for AMP-activated protein kinase in contraction- and hypoxia-regulated glucose transport in skeletal muscle. Mol Cell. 2001;7:1085–1094. - PubMed

Publication types