

Metabolomic analyses of plasma reveals new insights into asphyxia and resuscitation in pigs
- PMID: 20231903
- PMCID: PMC2834759
- DOI: 10.1371/journal.pone.0009606
Metabolomic analyses of plasma reveals new insights into asphyxia and resuscitation in pigs
Abstract
Background: Currently, a limited range of biochemical tests for hypoxia are in clinical use. Early diagnostic and functional biomarkers that mirror cellular metabolism and recovery during resuscitation are lacking. We hypothesized that the quantification of metabolites after hypoxia and resuscitation would enable the detection of markers of hypoxia as well as markers enabling the monitoring and evaluation of resuscitation strategies.
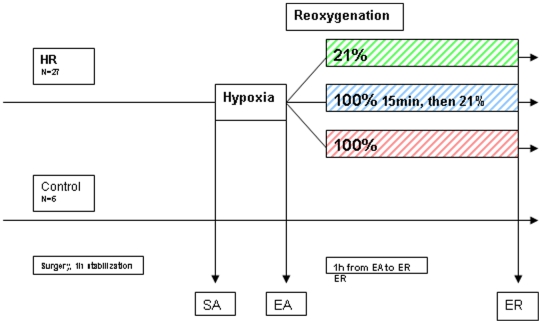
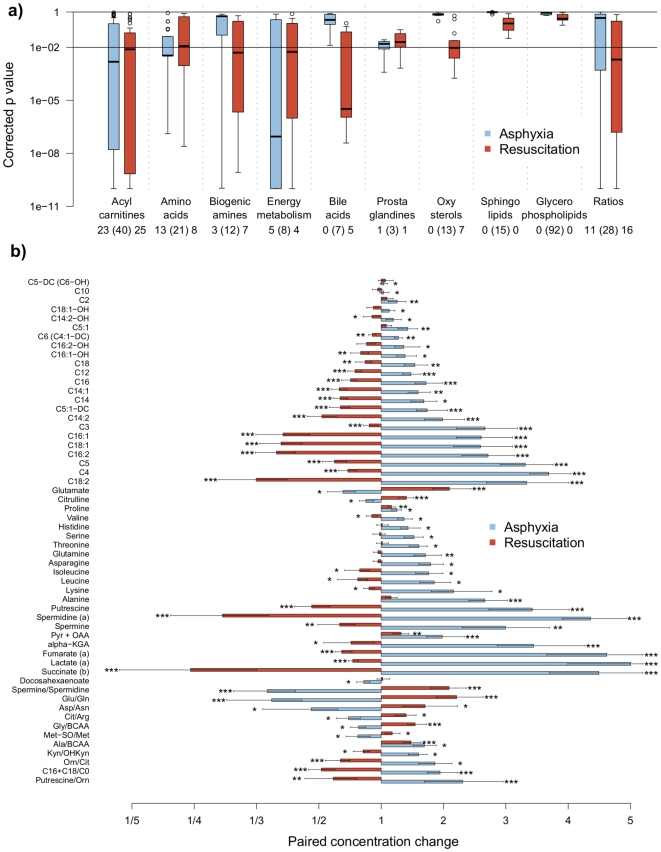
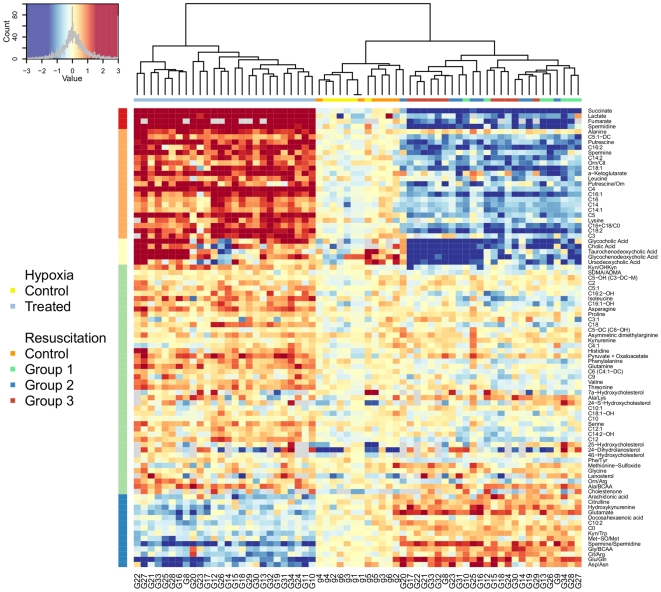
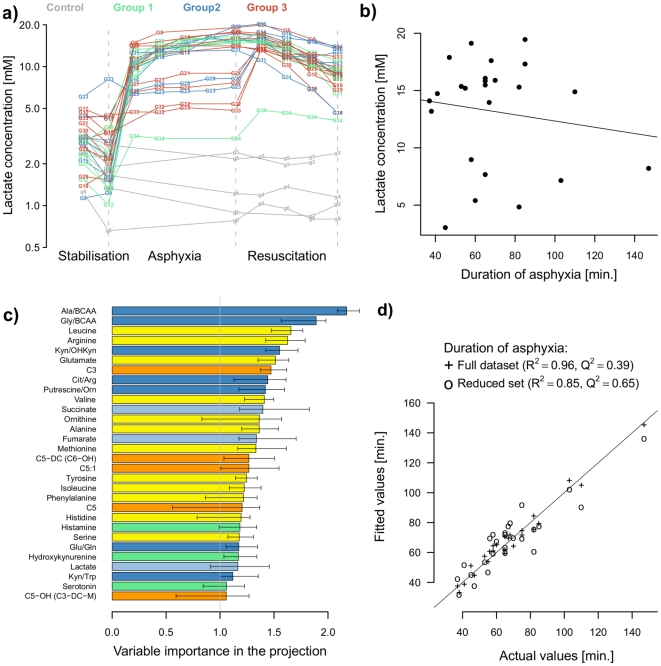
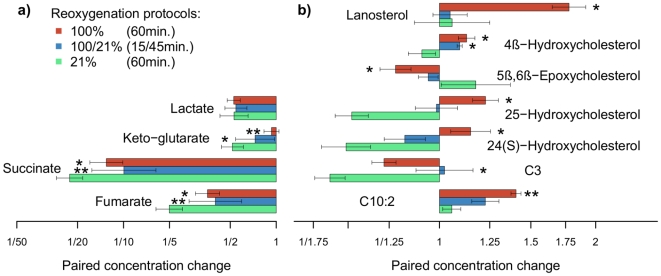
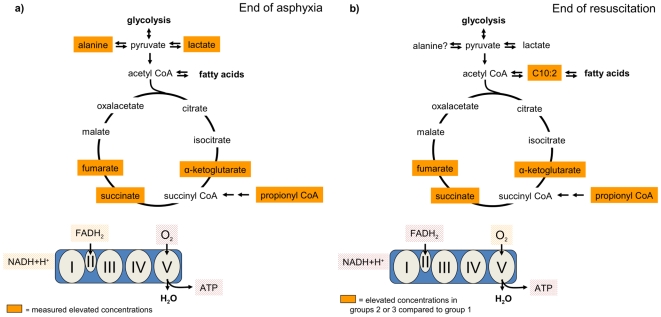
Methods and findings: Hypoxemia of different durations was induced in newborn piglets before randomization for resuscitation with 21% or 100% oxygen for 15 min or prolonged hyperoxia. Metabolites were measured in plasma taken before and after hypoxia as well as after resuscitation. Lactate, pH and base deficit did not correlate with the duration of hypoxia. In contrast to these, we detected the ratios of alanine to branched chained amino acids (Ala/BCAA; R(2).adj = 0.58, q-value<0.001) and of glycine to BCAA (Gly/BCAA; R(2).adj = 0.45, q-value<0.005), which were highly correlated with the duration of hypoxia. Combinations of metabolites and ratios increased the correlation to R(2)adjust = 0.92. Reoxygenation with 100% oxygen delayed cellular metabolic recovery. Reoxygenation with different concentrations of oxygen reduced lactate levels to a similar extent. In contrast, metabolites of the Krebs cycle (which is directly linked to mitochondrial function) including alpha keto-glutarate, succinate and fumarate were significantly reduced at different rates depending on the resuscitation, showing a delay in recovery in the 100% reoxygenation groups. Additional metabolites showing different responses to reoxygenation include oxysterols and acylcarnitines (n = 8-11, q<0.001).
Conclusions: This study provides a novel strategy and set of biomarkers. It provides biochemical in vivo data that resuscitation with 100% oxygen delays cellular recovery. In addition, the oxysterol increase raises concerns about the safety of 100% O(2) resuscitation. Our biomarkers can be used in a broad clinical setting for evaluation or the prediction of damage in conditions associated with low tissue oxygenation in both infancy and adulthood. These findings have to be validated in human trials.
Conflict of interest statement
Figures
Similar articles
-
Effects of post-resuscitation administration with sodium hydrosulfide on cardiac recovery in hypoxia-reoxygenated newborn piglets.Eur J Pharmacol. 2013 Oct 15;718(1-3):74-80. doi: 10.1016/j.ejphar.2013.09.017. Epub 2013 Sep 18. Eur J Pharmacol. 2013. PMID: 24056121
-
A metabolomic approach in an experimental model of hypoxia-reoxygenation in newborn piglets: urine predicts outcome.J Matern Fetal Neonatal Med. 2010 Oct;23 Suppl 3:134-7. doi: 10.3109/14767058.2010.517033. J Matern Fetal Neonatal Med. 2010. PMID: 20873980
-
Resuscitation with 21% or 100% oxygen is equally effective in restoring perfusion and oxygen metabolism in the liver of hypoxic newborn piglets.Shock. 2007 Jun;27(6):657-62. doi: 10.1097/shk.0b013e31802b63a4. Shock. 2007. PMID: 17505306
-
Therapeutic strategies to protect the immature newborn myocardium during resuscitation following asphyxia.Can J Physiol Pharmacol. 2012 Jun;90(6):689-95. doi: 10.1139/y2012-041. Epub 2012 Apr 17. Can J Physiol Pharmacol. 2012. PMID: 22510108 Review.
-
Perinatal asphyxia: a review from a metabolomics perspective.Molecules. 2015 Apr 17;20(4):7000-16. doi: 10.3390/molecules20047000. Molecules. 2015. PMID: 25898414 Free PMC article. Review.
Cited by
-
Isoflurane anesthesia initiated at the onset of reperfusion attenuates oxidative and hypoxic-ischemic brain injury.PLoS One. 2015 Mar 23;10(3):e0120456. doi: 10.1371/journal.pone.0120456. eCollection 2015. PLoS One. 2015. PMID: 25799166 Free PMC article.
-
Effect of Acetyl-L-carnitine Used for Protection of Neonatal Hypoxic-Ischemic Brain Injury on Acute Kidney Changes in Male and Female Rats.Neurochem Res. 2019 Oct;44(10):2405-2412. doi: 10.1007/s11064-019-02807-3. Epub 2019 Apr 30. Neurochem Res. 2019. PMID: 31041669 Free PMC article.
-
Assessment of phospholipid synthesis related biomarkers for perinatal asphyxia: a piglet study.Sci Rep. 2017 Jan 10;7:40315. doi: 10.1038/srep40315. Sci Rep. 2017. PMID: 28071721 Free PMC article.
-
Emerging Biomarkers for Prediction and Early Diagnosis of Necrotizing Enterocolitis in the Era of Metabolomics and Proteomics.Front Pediatr. 2020 Dec 8;8:602255. doi: 10.3389/fped.2020.602255. eCollection 2020. Front Pediatr. 2020. PMID: 33425815 Free PMC article. Review.
-
The Role of Plasma and Urine Metabolomics in Identifying New Biomarkers in Severe Newborn Asphyxia: A Study of Asphyxiated Newborn Pigs following Cardiopulmonary Resuscitation.PLoS One. 2016 Aug 16;11(8):e0161123. doi: 10.1371/journal.pone.0161123. eCollection 2016. PLoS One. 2016. PMID: 27529347 Free PMC article.
References
-
- International Consensus on Cardiopulmonary Resuscitation and Emergency Cardiovascular Care Science with Treatment Recommendations. Part 7: Neonatal resuscitation. Resuscitation. 2005;67:293–303. - PubMed
-
- Saugstad OD, Ramji S, Irani SF, El-Meneza S, Hernandez EA, et al. Resuscitation of newborn infants with 21% or 100% oxygen: follow-up at 18 to 24 months. Pediatrics. 2003;112:296–300. - PubMed
-
- Saugstad OD, Ramji S, Soll RF, Vento M. Resuscitation of Newborn Infants with 21% or 100% Oxygen: An Updated Systematic Review and Meta-Analysis. Neonatology. 2008;94:176–82. - PubMed
-
- Vento M, Sastre J, Asensi MA, Vina J. Room-air resuscitation causes less damage to heart and kidney than 100% oxygen. Am J Respir Crit Care Med. 2005;172:1393–8. - PubMed
-
- Davis PG, Tan A, O'Donnell CP, Schulze A. Resuscitation of newborn infants with 100% oxygen or air: a systematic review and meta-analysis. Lancet. 2004;364:1329–33. - PubMed
Publication types
MeSH terms
Substances
LinkOut - more resources
Full Text Sources
Other Literature Sources
