

Comparing approaches for studying the effects of climate extremes - a case study of hospital admissions in Sweden during an extremely warm summer
- PMID: 20231906
- PMCID: PMC2838415
- DOI: 10.3402/gha.v2i0.2034
Comparing approaches for studying the effects of climate extremes - a case study of hospital admissions in Sweden during an extremely warm summer
Abstract
Background: Health effects induced by climate, weather and climatic change may act directly or indirectly on human physiology. The future total burden of global warming is uncertain, but in some areas and for specific outcomes, mortality and morbidity are likely to increase. One likely effect of global warming is an increasing number of extreme weather events, such as floods, storms and heat waves. The excess numbers of specific health outcomes attributable to climate-induced events can be estimated. This paper compares approaches for estimating excess numbers of outcomes associated with climate extremes, exemplified by a case study of hospital admissions during the extremely warm summer of 2006 in southern Sweden.
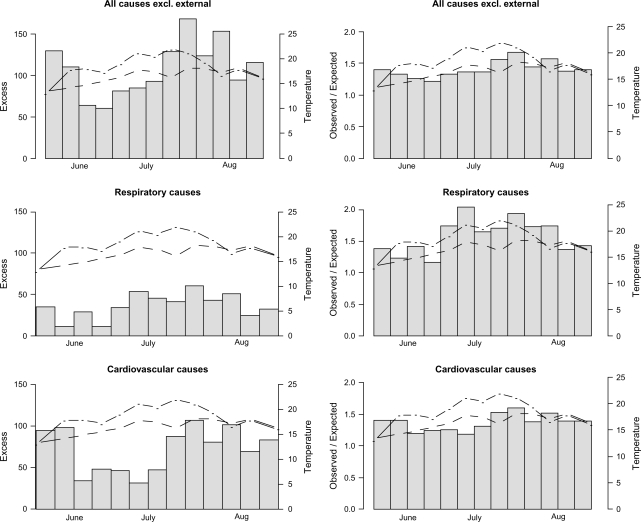
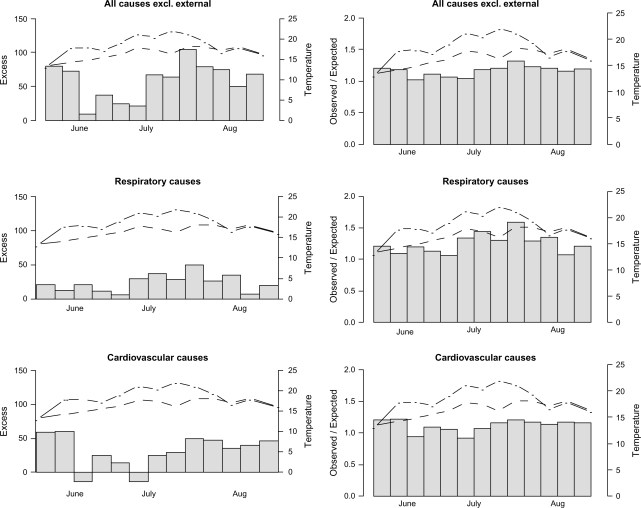
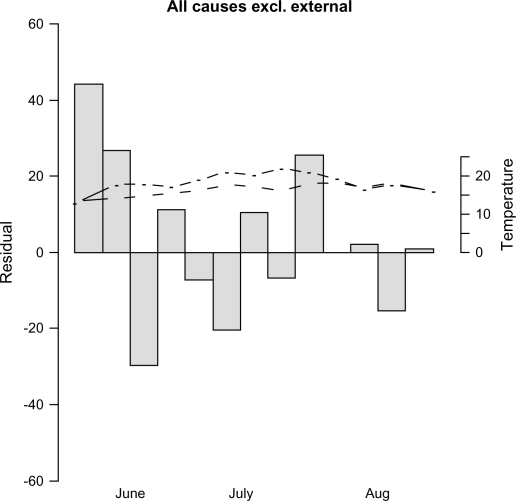
Materials and methods: Daily hospital admission data were obtained from the Swedish National Board of Health and Welfare for six hospitals in the Skåne region of southern Sweden for the period 1998 to 2006. Daily temperature data for the region were obtained from the meteorological station in the city of Malmö. We used four established approaches for estimating the daily excess numbers associated with extreme heat. Time series of daily event rates were assumed to follow a Poisson distribution. Excess event rates were compared by using several approaches, such as standardised event ratios and generalised additive models to estimate the health risks attributable to the extreme climate event.
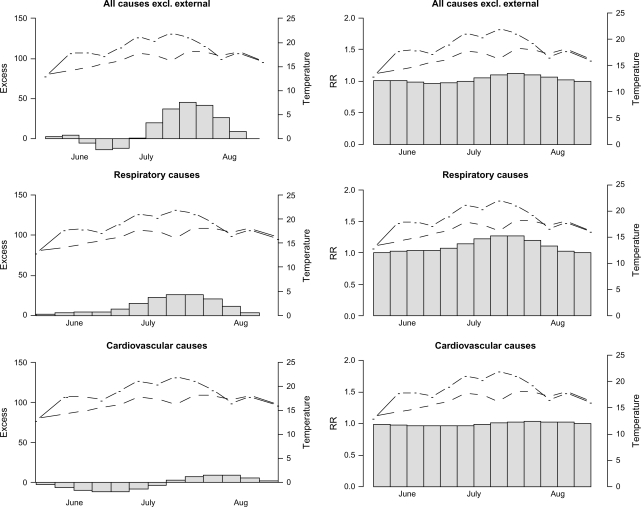
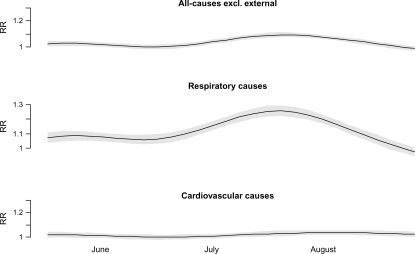
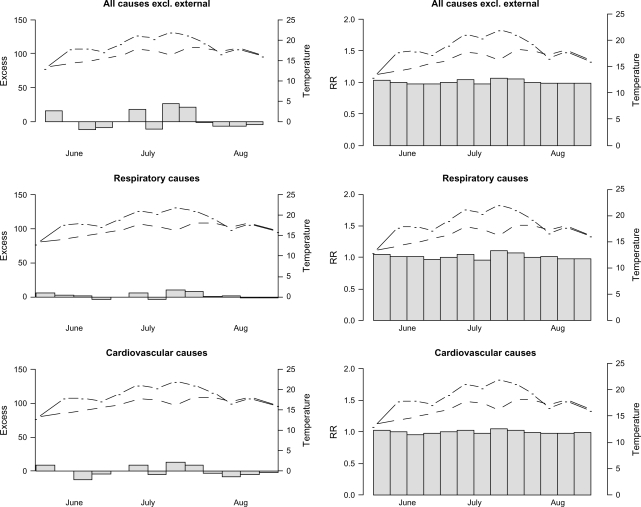
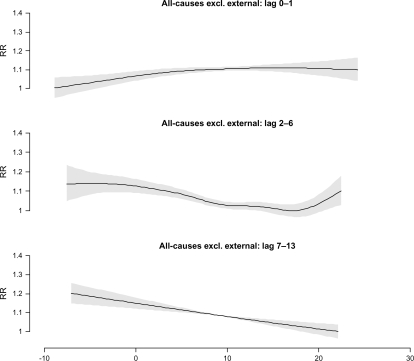
Results: The four approaches yielded vastly different results. The estimates of excess were considerably biased when not accounting for time trends in previous years' data. Three of four approaches showed a significant increase in excess hospitalisation rates attributable to the heat episode in Skåne in 2006. However, modelling the effect of temperature failed to describe the risks induced by the extreme heat.
Conclusion: Estimates of excess events depend greatly on the approach used. Further research is needed to identify which method yielded the most accurate estimates. However, one of the approaches used generally seem to perform better than the others in estimating the excess rates associated with the heat episode. Further on, estimating relative risks of temperature or other determinants of disease may fail to incorporate the unique characteristics of particular weather events, such as the effect caused by very persistent heat exposure. Unless this can be incorporated into predictive models, such models may be less appropriate to use when predicting the future burden of heat waves on human health.
Keywords: climate change; extreme event; heat; hospital admission; surveillance; temperature; weather.
Figures
References
-
- Confalonieri U, Menne B, Akhtar R, Ebi KL, Hauengue M, Kovats RS, et al. Human health. In: Parry ML, Canziani OF, Palutikof JP, van der Linden PJ, Hanson CE, editors. Climate change 2007: impacts, adaptation and vulnerability. Contribution of Working Group II to the fourth assessment report of the Intergovernmental Panel on Climate Change. Cambridge: Cambridge University Press; 2007. pp. 391–431.
-
- Koelle K, Rodo X, Pascual M, Yunus M, Mostafa G. Refractory periods and climate forcing in cholera dynamics. Nature. 2005;463:696–700. - PubMed
-
- Lindgren E, Gustafson R. Tick-borne encephalitis in Sweden and climate change. Lancet. 2001;358:1731–2. - PubMed
-
- Kovats S, Hajat S. Heat stress and public health. Annu Rev Public Health. 2008;29:41–55. - PubMed
-
- Basu R, Samet JR. Relation between elevated ambient temperature and mortality: a review of the epidemiologic evidence. J Epidemol Rev. 2002;24:190–202. - PubMed
LinkOut - more resources
Full Text Sources