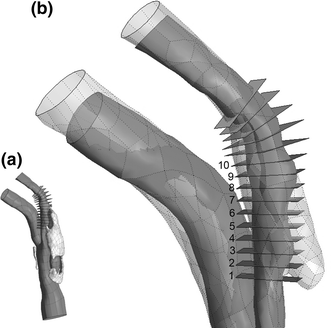
Carotid atheroma rupture observed in vivo and FSI-predicted stress distribution based on pre-rupture imaging
- PMID: 20232151
- PMCID: PMC2900591
- DOI: 10.1007/s10439-010-0004-8
Carotid atheroma rupture observed in vivo and FSI-predicted stress distribution based on pre-rupture imaging
Abstract
Atherosclerosis at the carotid bifurcation is a major risk factor for stroke. As mechanical forces may impact lesion stability, finite element studies have been conducted on models of diseased vessels to elucidate the effects of lesion characteristics on the stresses within plaque materials. It is hoped that patient-specific biomechanical analyses may serve clinically to assess the rupture potential for any particular lesion, allowing better stratification of patients into the most appropriate treatments. Due to a sparsity of in vivo plaque rupture data, the relationship between various mechanical descriptors such as stresses or strains and rupture vulnerability is incompletely known, and the patient-specific utility of biomechanical analyses is unclear. In this article, we present a comparison between carotid atheroma rupture observed in vivo and the plaque stress distribution from fluid-structure interaction analysis based on pre-rupture medical imaging. The effects of image resolution are explored and the calculated stress fields are shown to vary by as much as 50% with sub-pixel geometric uncertainty. Within these bounds, we find a region of pronounced elevation in stress within the fibrous plaque layer of the lesion with a location and extent corresponding to that of the observed site of plaque rupture.
Figures


Similar articles
-
Mechanical stresses in carotid plaques using MRI-based fluid-structure interaction models.J Biomech. 2008;41(8):1651-8. doi: 10.1016/j.jbiomech.2008.03.019. Epub 2008 May 15. J Biomech. 2008. PMID: 18485351
-
How critical is fibrous cap thickness to carotid plaque stability? A flow-plaque interaction model.Stroke. 2006 May;37(5):1195-9. doi: 10.1161/01.STR.0000217331.61083.3b. Epub 2006 Mar 30. Stroke. 2006. PMID: 16574926
-
On the Impact of Residual Strains in the Stress Analysis of Patient-Specific Atherosclerotic Carotid Vessels: Predictions Based on the Homogenous Stress Hypothesis.Ann Biomed Eng. 2024 May;52(5):1347-1358. doi: 10.1007/s10439-024-03458-4. Epub 2024 Feb 13. Ann Biomed Eng. 2024. PMID: 38349443 Free PMC article.
-
Modern methods for imaging carotid atheroma.Br J Neurosurg. 2008 Jun;22(3):350-9. doi: 10.1080/02688690802007891. Br J Neurosurg. 2008. PMID: 18568723 Review.
-
Introduction to the biomechanics of carotid plaque pathogenesis and rupture: review of the clinical evidence.Br J Radiol. 2010 Sep;83(993):729-35. doi: 10.1259/bjr/49957752. Epub 2010 Jul 20. Br J Radiol. 2010. PMID: 20647514 Free PMC article. Review.
Cited by
-
3D MRI-based multicomponent thin layer structure only plaque models for atherosclerotic plaques.J Biomech. 2016 Sep 6;49(13):2726-2733. doi: 10.1016/j.jbiomech.2016.06.002. Epub 2016 Jun 8. J Biomech. 2016. PMID: 27344199 Free PMC article.
-
Quantifying effect of intraplaque hemorrhage on critical plaque wall stress in human atherosclerotic plaques using three-dimensional fluid-structure interaction models.J Biomech Eng. 2012 Dec;134(12):121004. doi: 10.1115/1.4007954. J Biomech Eng. 2012. PMID: 23363206 Free PMC article.
-
Plaque Structural Stress: Detection, Determinants and Role in Atherosclerotic Plaque Rupture and Progression.Front Cardiovasc Med. 2022 Jul 7;9:875413. doi: 10.3389/fcvm.2022.875413. eCollection 2022. Front Cardiovasc Med. 2022. PMID: 35872913 Free PMC article. Review.
-
Accurate Calculation of FFR Based on a Physics-Driven Fluid-Structure Interaction Model.Front Physiol. 2022 Apr 12;13:861446. doi: 10.3389/fphys.2022.861446. eCollection 2022. Front Physiol. 2022. PMID: 35492614 Free PMC article.
-
Identification of intra-individual variation in intracranial arterial flow by MRI and the effect on computed hemodynamic descriptors.MAGMA. 2021 Oct;34(5):659-666. doi: 10.1007/s10334-021-00917-0. Epub 2021 Apr 11. MAGMA. 2021. PMID: 33839985 Free PMC article.
References
-
- Binns RL, Ku DN. Effect of stenosis on wall motion. A possible mechanism of stroke and transient ischemic attack. Arteriosclerosis. 1989;9(6):842–847. - PubMed
Publication types
MeSH terms
Grants and funding
LinkOut - more resources
Full Text Sources
Medical
Research Materials

