Comparative Study
. 2010 Aug;38(8):2577-87.
doi: 10.1007/s10439-010-0002-x. Epub 2010 Mar 16.

Temporal effects of mechanical loading on deformation-induced damage in skeletal muscle tissue

Affiliations
Comparative Study

Temporal effects of mechanical loading on deformation-induced damage in skeletal muscle tissue

S Loerakker et al. Ann Biomed Eng. 2010 Aug.

Abstract

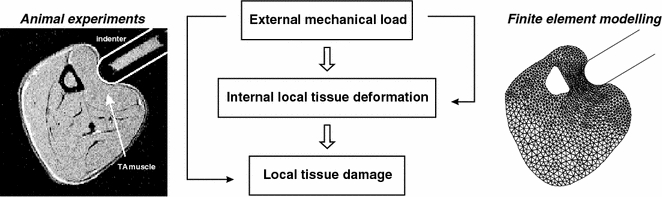
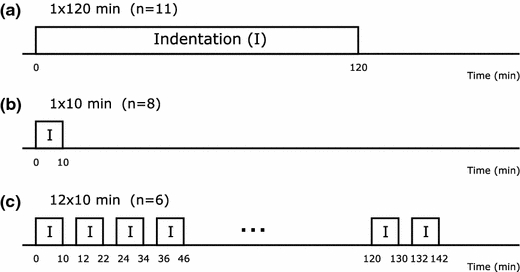
Mechanical loading of soft tissues covering bony prominences can cause skeletal muscle damage, ultimately resulting in a severe pressure ulcer termed deep tissue injury. Recently, by means of an experimental-numerical approach, it was shown that local tissue deformations cause tissue damage once a deformation threshold is exceeded. In the present study, the effects of load exposure time and intermittent load relief on the development of deformation-induced muscle damage were investigated. The data showed that a 2 h loading period caused more damage than 10 min loading. Intermittent load reliefs of 2 min during a 2 h loading period had minimal effect on the evolution of skeletal muscle damage. In addition, a local deformation threshold for damage was found, which was similar for each of the loading regimes applied in this study. For short loading periods, these results imply that local tissue deformations determine whether muscle damage will develop and the exposure time influences the amount of tissue damage. Temporary load reliefs were inefficient in reducing deformation-induced damage, but may still influence the development of ischemia-induced damage during longer loading periods.


Figures

Figure 1
Figure 1
Schematic overview of the experimental-numerical approach. Animal experiments were performed in which the damage evolution due to compressive loading was studied with MRI. Dedicated FE models were developed to estimate local tissue deformations during loading. Left: MR image of a cross-section of the lower leg of a rat with an indenter compressing the tibialis anterior (TA) muscle. MRI was also used to detect locations of muscle damage after release of the indenter. Right: Dedicated FE model of the corresponding cross-section of the leg
Figure 2
Figure 2
Schematic representation of the experimental setup (from Stekelenburg et al. with permission)
Figure 3
Figure 3
Overview of three loading regimes. (a) 2 h continuous loading of the tibialis anterior (TA) muscle by indentation. This loading regime was compared with (b) a shorter loading period (10 min) and (c) with 2 h intermittent loading (12 × 10 min loading with 2 min recovery in between). n denotes the number of animals that were subjected to the different loading regimes
Figure 4
Figure 4
(a) Transversal scout image of a cross-section of a rat leg before loading. Contours of leg and tibia were determined (white lines) and used for mesh generation. (b) Scout image of the same rat leg during loading. Position of the tibia during loading and angle and depth of indentation were determined (solid lines) and used for the essential boundary conditions (contours of leg before loading are shown by dashed lines). (c) Resulting FE mesh of the rat leg with indenter and plaster cast modeled as rigid bodies
Figure 5
Figure 5
(a) T2 map of a rat leg 90 min after unloading. A region of interest around the TA muscle was selected (white box). (b) A grid was positioned at the pixel centers within this region. Grid points where T2 was significantly increased are shown in white. (c) The grid was mapped to the original undeformed FE mesh to obtain a reference configuration. (d) Grid deformed to the situation during loading
Figure 6
Figure 6
Strain energy density in the grid (color) where locations with a significant increase in T2 are indicated by white circles. (a) Global analysis: The strain energy density was integrated over the grid to obtain the 2D strain energy, and the area of elevated T2 values in the grid was used as a measure of damage. (b) Local analysis: ∼25 regions (green) of 3 × 3 grid points were positioned in a smaller area (red box). For each region, the mean strain energy density and the fraction of grid points with elevated T2 were determined
Figure 7
Figure 7
Scout images with corresponding FE model contours (yellow), T2 maps with ROI (purple) including the TA muscle, and distributions of W (color) together with locations of T2 increase (white circles) in the ROI for a typical experiment with 2 h continuous loading (a–d), 10 min loading (e–h), and 2 h intermittent (12 × 10 min) loading (i–l)
Figure 8
Figure 8
Mean area A d with significantly increased T2 values in the TA muscle vs. the mean 2D strain energy E in the muscle during indentation
Figure 9
Figure 9
(a) Probability p on a significant increase in T2 as a function of the mean strain energy density formula image. (b) Receiver operating characteristic (ROC) curves for the three loading regimes

References

    1. Akobeng AK. Understanding diagnostic tests 3: receiver operating characteristic curves. Acta Paediatr. 2007;96(5):644–647. doi: 10.1111/j.1651-2227.2006.00178.x. - DOI - PubMed
    1. Black J, Baharestani M, Cuddigan J, Dorner B, Edsberg L, Langemo D, Posthauer ME, Ratliff C, Taler G, NPUAP National pressure ulcer advisory panel’s updated pressure ulcer staging system. Dermatol. Nurs. 2007;19(4):343–349. - PubMed
    1. Bosboom EMH, Bouten CVC, Oomens CWJ, Baaijens FPT, Nicolay K. Quantifying pressure sore-related muscle damage using high-resolution MRI. J. Appl. Physiol. 2003;95(6):2235–2240. - PubMed
    1. Bosboom EMH, Hesselink MKC, Oomens CWJ, Bouten CVC, Drost MR, Baaijens FPT. Passive transverse mechanical properties of skeletal muscle under in vivo compression. J. Biomech. 2001;34(10):1365–1368. doi: 10.1016/S0021-9290(01)00083-5. - DOI - PubMed
    1. Bouten CV, Knight MM, Lee DA, Bader DL. Compressive deformation and damage of muscle cell subpopulations in a model system. Ann. Biomed. Eng. 2001;29(2):153–163. doi: 10.1114/1.1349698. - DOI - PubMed

Publication types