. 2010 Mar;62(3):237-46.
doi: 10.1002/iub.314.

C-Myc is a Nrf2-interacting protein that negatively regulates phase II genes through their electrophile responsive elements

Affiliations

C-Myc is a Nrf2-interacting protein that negatively regulates phase II genes through their electrophile responsive elements

Smadar Levy et al. IUBMB Life. 2010 Mar.

Abstract

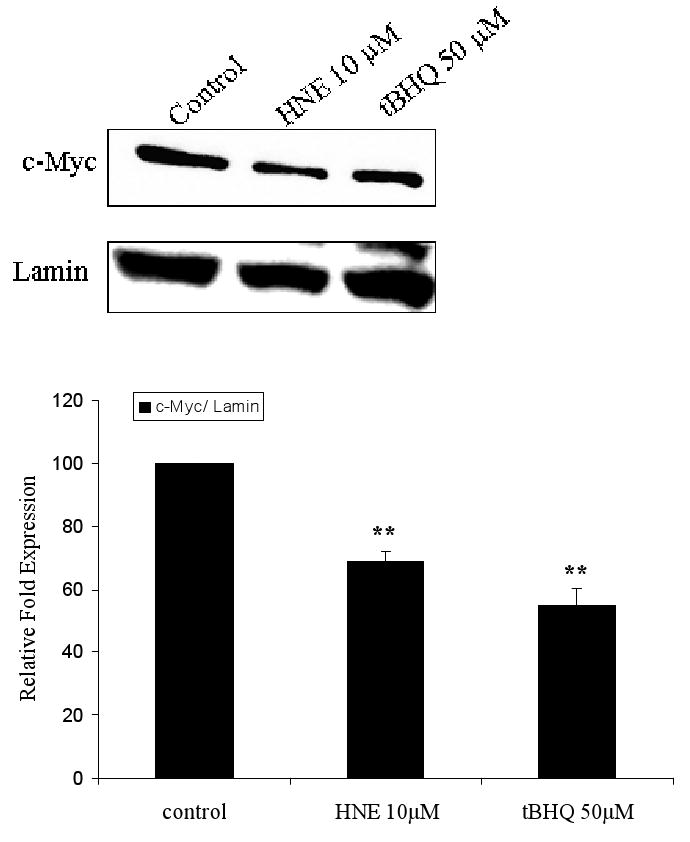
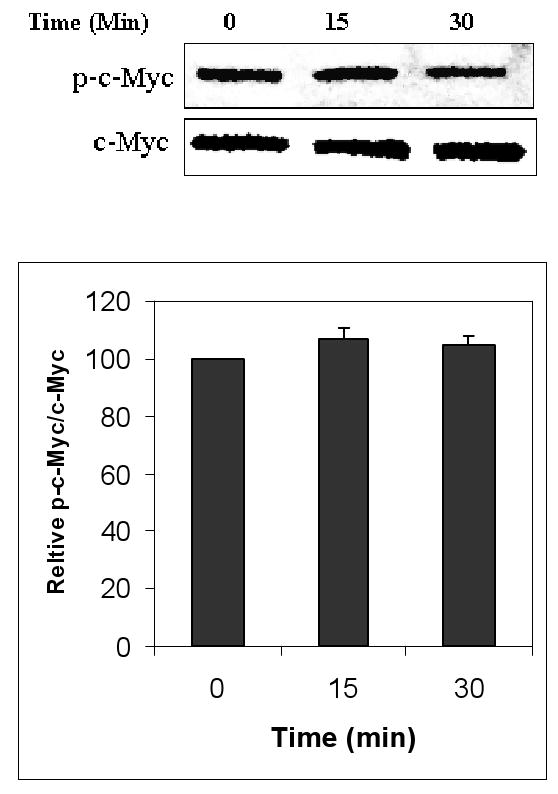
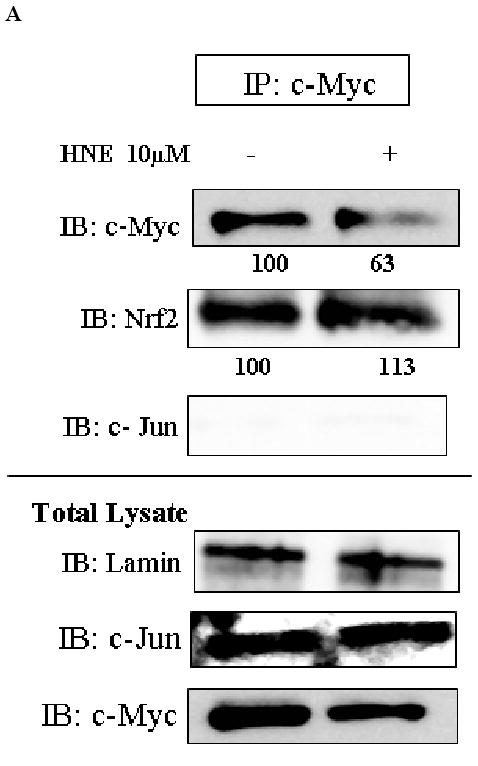
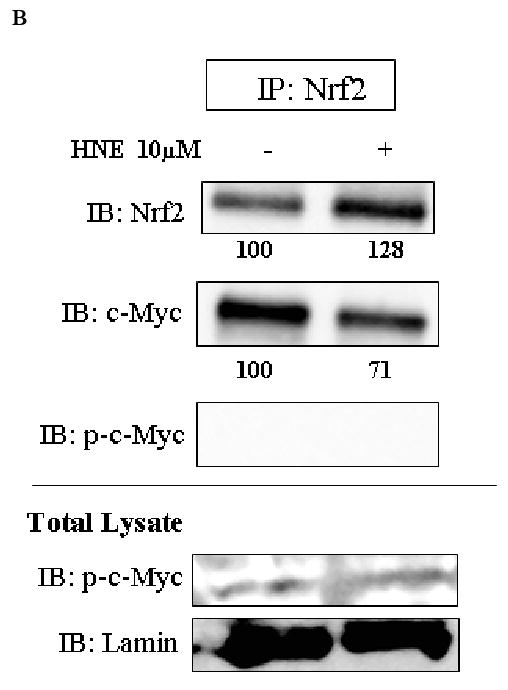
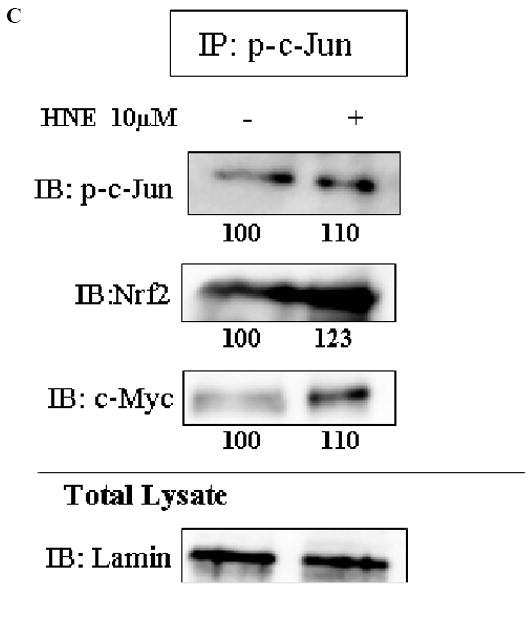
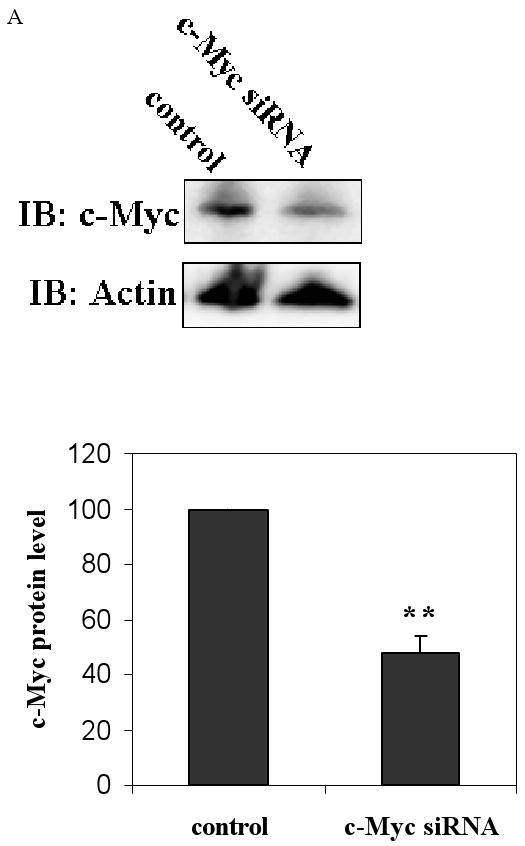
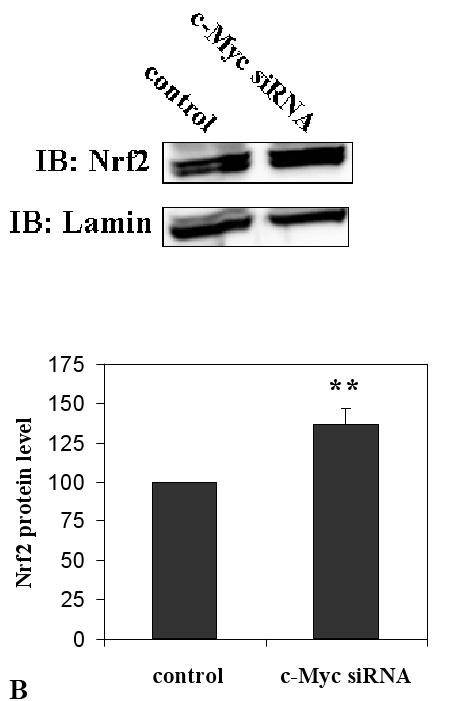
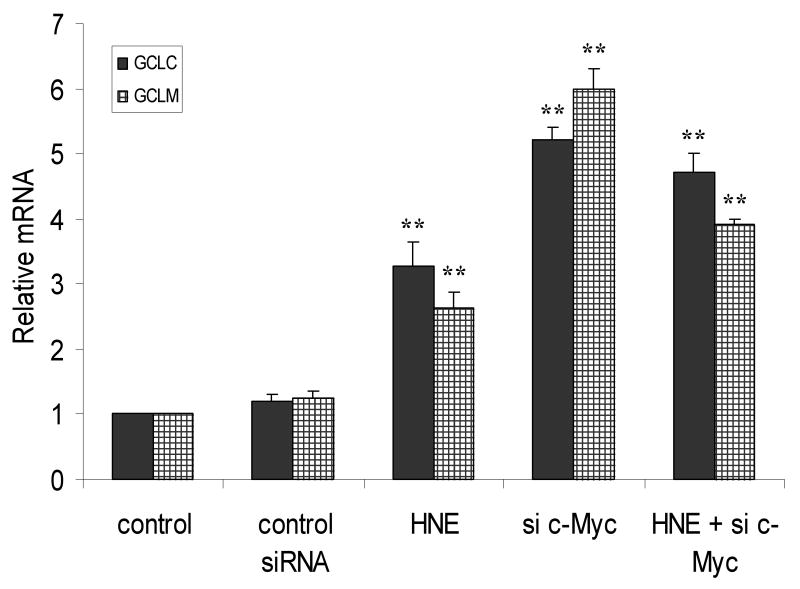
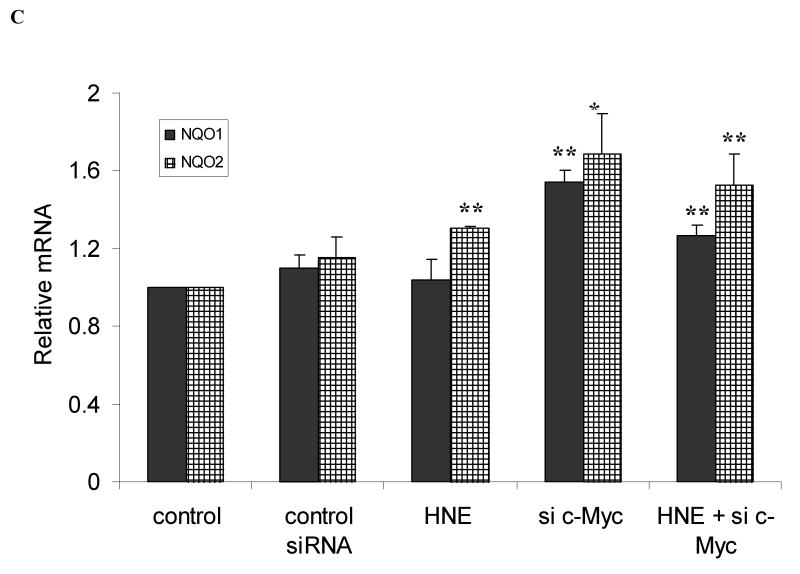
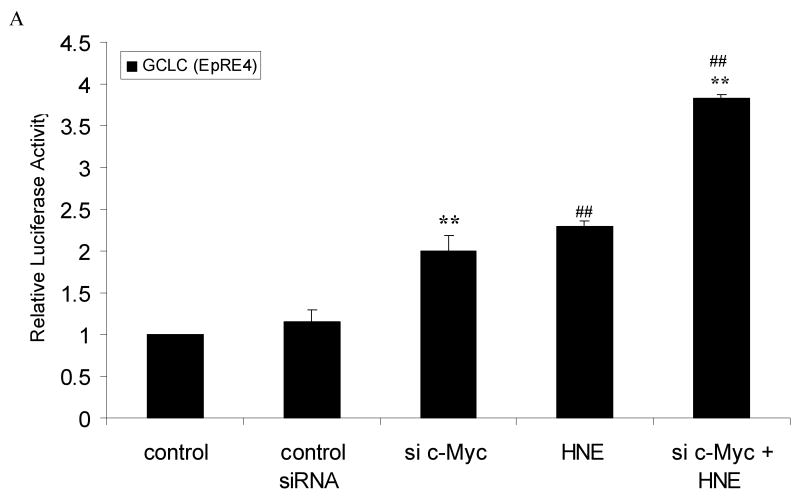
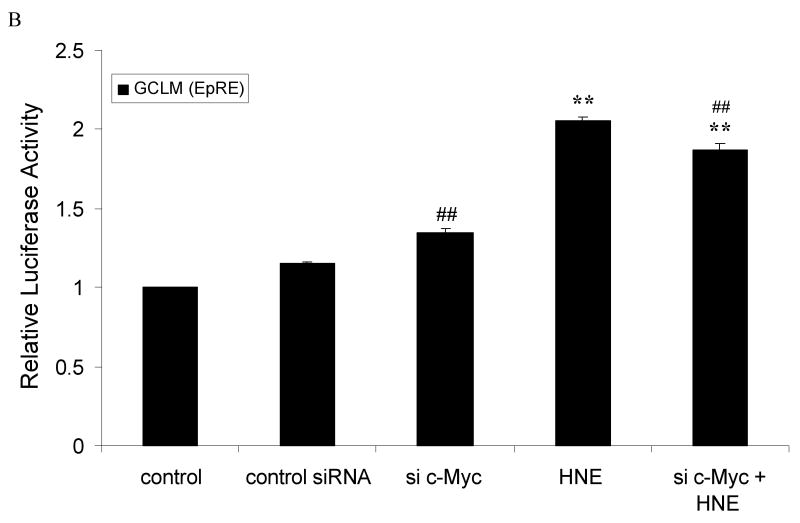
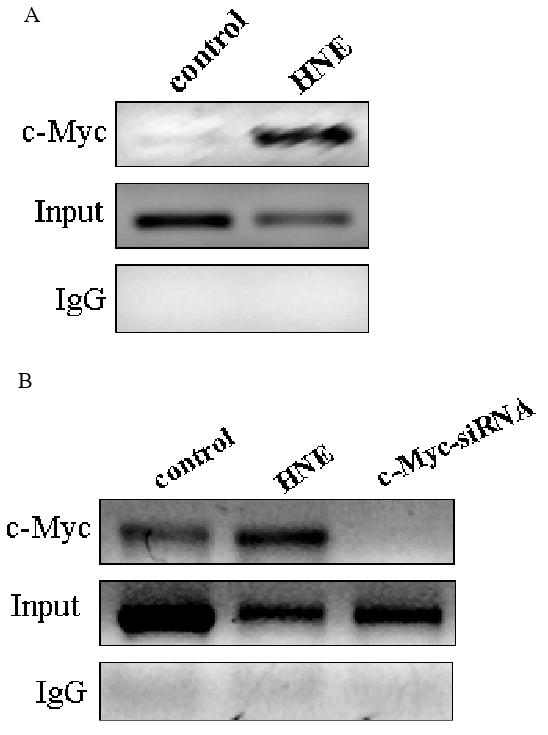
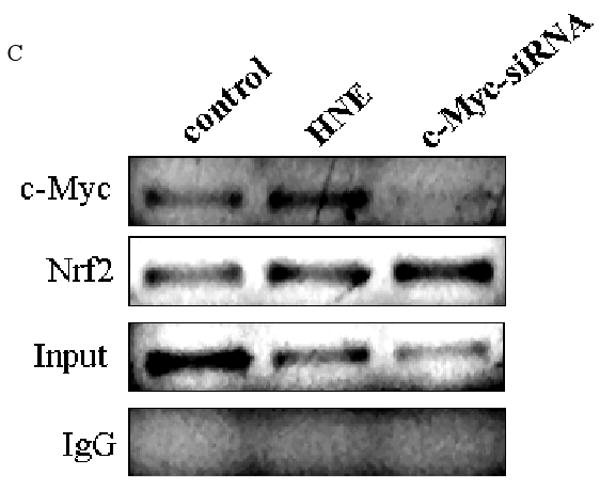
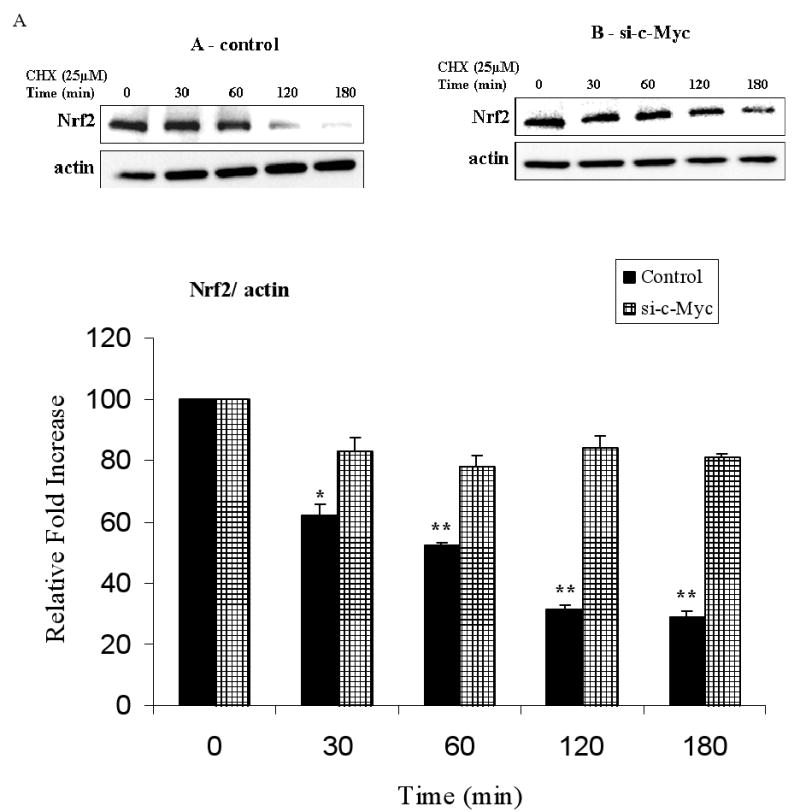
c-Myc is a transcription factor that is implicated in many cellular processes including proliferation, apoptosis and cancers. Recently, c-Myc was shown to be involved in regulation of glutamate cysteine ligase through E-box sequences. This investigation examined whether c-Myc also regulates phase II genes through interaction with the electrophile response element (EpRE). Experiments were conducted in human bronchial epithelial cells using si-RNA to knock down c-Myc. RT-PCR and reporter assays were used to measure transcription and promoter activity. c-Myc downregulated transcription and promoter activity of phase II genes. Chromatin immunoprecipitation verified binding of c-Myc to EpRE while coimmunoprecipitation demonstrated interaction of c-Myc with Nrf2. c-Myc also forms a ternary complex with Nrf2 and p-c-Jun. Finally, c-Myc decreased Nrf2 stability. Thus, our results suggest regulation of the EpRE/Nrf2 signaling pathway by c-Myc through both interaction with the EpRE binding complex and increased degradation of Nrf2.


Figures

Fig. 1
Fig. 1
Expression of c-Myc protein in the nucleus of HBE1 cells under basal and induced conditions. Cells were grown to confluence and treated with 10 μM HNE, 50 μM tBHQ, or vehicle control for 3 h. Nuclear extracts were collected and 30 μg protein aliquots were subjected to western blot analyses with anti c-Myc antibody. Lamin was used as loading control and identified with anti-lamin antibody. The band intensity of c-Myc and lamin was quantified, and the c-Myc protein level was normalized to the lamin intensity. The error bars indicate standard deviations from 3 experiments.
Fig. 2
Fig. 2
Effect of HNE on the phosphorylation of c-Myc. HBE1 cells were treated with 10 μM HNE for the indicated time points. Whole cell extracts were collected and subjected to immunobloting with anti p-c-Myc. c-Myc was used as loading control and identified with anti-c-Myc antibody. The figure shows a representative experiment and graph reported as mean ± S.E. out of three independent experiments.
Fig. 3
Fig. 3
Interaction of c-Myc with either Nrf2 or p-c-Jun at both basal and induced conditions. HBE1 cells were treated with 10 μM HNE or vehicle control for 3 hours. Nuclear proteins were immunoprecipitated with the indicated antibodies: A. c-Myc. B. Nrf2. C. p-c-Jun, and visualized by Western blot analysis with anti Nrf2, anti c-Myc, anti p-c-Jun, anti p-c-Myc or anti c-Jun antibodies. Lamin was used as loading control and identified with anti-lamin antibody. Expression levels of the indicated proteins in the whole cell extract are shown in total lysate (lower panels).
Fig. 3
Fig. 3
Interaction of c-Myc with either Nrf2 or p-c-Jun at both basal and induced conditions. HBE1 cells were treated with 10 μM HNE or vehicle control for 3 hours. Nuclear proteins were immunoprecipitated with the indicated antibodies: A. c-Myc. B. Nrf2. C. p-c-Jun, and visualized by Western blot analysis with anti Nrf2, anti c-Myc, anti p-c-Jun, anti p-c-Myc or anti c-Jun antibodies. Lamin was used as loading control and identified with anti-lamin antibody. Expression levels of the indicated proteins in the whole cell extract are shown in total lysate (lower panels).
Fig. 4
Fig. 4
Knockdown of c-Myc up- regulates transcription of self defense genes. A. c-Myc knockdown decreased the protein level of c-Myc. Cells were transfected with 50 nM c-Myc-siRNA or control siRNA for 48 h. c-Myc and Nrf2 proteins were then detected by western blot analyses. B. c-Myc knockdown increases the expression of GCLC (black columns) and GCLM (net columns) mRNA. HBE1 cells were transfected with control si-RNA or 50 nM c-Myc-siRNA. Following 24 h of transfection cells were treated or untreated with HNE for 18 h and mRNA expression was measured. Cells were also treated with 10 μM HNE alone. C. c-Myc knockdown increases the expression of NQO1 (black columns) and NQO2 (net columns) mRNA. HBE1 cells were transfected with control siRNA or 50 nM c-Myc–siRNA. Following 24 h transfection cells were treated or untreated with HNE for 18 h. Cells were treated with 10 μM HNE alone and mRNA expression were analyzed by RT-PCR. C. Results are reported as mean ± S.E for four independent experiments. * p<0.05, significantly different from control. ** p<0.01, significantly different from its control.
Fig. 4
Fig. 4
Knockdown of c-Myc up- regulates transcription of self defense genes. A. c-Myc knockdown decreased the protein level of c-Myc. Cells were transfected with 50 nM c-Myc-siRNA or control siRNA for 48 h. c-Myc and Nrf2 proteins were then detected by western blot analyses. B. c-Myc knockdown increases the expression of GCLC (black columns) and GCLM (net columns) mRNA. HBE1 cells were transfected with control si-RNA or 50 nM c-Myc-siRNA. Following 24 h of transfection cells were treated or untreated with HNE for 18 h and mRNA expression was measured. Cells were also treated with 10 μM HNE alone. C. c-Myc knockdown increases the expression of NQO1 (black columns) and NQO2 (net columns) mRNA. HBE1 cells were transfected with control siRNA or 50 nM c-Myc–siRNA. Following 24 h transfection cells were treated or untreated with HNE for 18 h. Cells were treated with 10 μM HNE alone and mRNA expression were analyzed by RT-PCR. C. Results are reported as mean ± S.E for four independent experiments. * p<0.05, significantly different from control. ** p<0.01, significantly different from its control.
Fig. 5
Fig. 5
Silencing of c-Myc up-regulated the EpRE-reporter gene activity of GCLC and GCLM. HBE1 cells were transfected with control siRNA or c-Myc-si-RNA. Expression vectors contained: A. EpRE4 (GCLC) or B. EpRE (GCLM). Luciferase reporter constructs were transfected 24 h post si-RNA transfection. The transfected cells were treated with 10μM HNE or vehicle control for 24 h prior to the measurement of luciferase activities. A & B. Cells were transfected with 50 nM c-Myc-siRNA or non-specific si-RNA followed by transfection with either EpRE4 (GCLC) or EpRE (GCLM) plasmid, respectively. Then the cells were treated or untreated with HNE 10μM for additional 24 h. Results are reported as mean ± S.E. for at least three determinations. ** p<0.01, significantly different from control. # p<0.05, ## p<0.01, significantly different from control siRNA.
Fig. 5
Fig. 5
Silencing of c-Myc up-regulated the EpRE-reporter gene activity of GCLC and GCLM. HBE1 cells were transfected with control siRNA or c-Myc-si-RNA. Expression vectors contained: A. EpRE4 (GCLC) or B. EpRE (GCLM). Luciferase reporter constructs were transfected 24 h post si-RNA transfection. The transfected cells were treated with 10μM HNE or vehicle control for 24 h prior to the measurement of luciferase activities. A & B. Cells were transfected with 50 nM c-Myc-siRNA or non-specific si-RNA followed by transfection with either EpRE4 (GCLC) or EpRE (GCLM) plasmid, respectively. Then the cells were treated or untreated with HNE 10μM for additional 24 h. Results are reported as mean ± S.E. for at least three determinations. ** p<0.01, significantly different from control. # p<0.05, ## p<0.01, significantly different from control siRNA.
Fig. 6
Fig. 6
Recruitment of c-Myc to EpRE promoter. c-Myc interacts with the promoter of A. GCLM (EpRE) B. NQO1 (EpRE) and C. GCLC (EpRE4) under both basal and induced conditions in HBE1 cells. ChIP assays were performed to examine the in vivo interaction of c-Myc with EpRE that either treated or untreated with 10 μM HNE. In panel B and C cells were transfected with 50 nM c-Myc-siRNA for 24 h or treated with HNE for 3 h. Vehicle and non-specific siRNA was used in the controls. After stimulation with HNE or transfection with si-RNA, cells were fixed with 1% formaldehyde, lysed, and sonicated to shear chromatin in 0.2-0.8-kb fragments, which were then immunoprecipitated with anti c-Myc antibody or anti Nrf2 antibody. Purified DNA was then analyzed with RT-PCR with specific primers amplifying EpRE elements. Results are indicating a representative experiment out of four.
Fig. 6
Fig. 6
Recruitment of c-Myc to EpRE promoter. c-Myc interacts with the promoter of A. GCLM (EpRE) B. NQO1 (EpRE) and C. GCLC (EpRE4) under both basal and induced conditions in HBE1 cells. ChIP assays were performed to examine the in vivo interaction of c-Myc with EpRE that either treated or untreated with 10 μM HNE. In panel B and C cells were transfected with 50 nM c-Myc-siRNA for 24 h or treated with HNE for 3 h. Vehicle and non-specific siRNA was used in the controls. After stimulation with HNE or transfection with si-RNA, cells were fixed with 1% formaldehyde, lysed, and sonicated to shear chromatin in 0.2-0.8-kb fragments, which were then immunoprecipitated with anti c-Myc antibody or anti Nrf2 antibody. Purified DNA was then analyzed with RT-PCR with specific primers amplifying EpRE elements. Results are indicating a representative experiment out of four.
Fig. 7
Fig. 7
c-Myc knock down stabilized Nrf2 by increasing its half-life. HBE1 control cells A. or transfected with 50 nM c-Myc-siRNA B. were treated with 25 μM cyclohexamide (CHX) at 48 h post transfection and incubated for the time periods indicated in figure. Total proteins were collected and endogenous Nrf2 was detected by immunoblot analysis, and the intensity of the Nrf2 bands was quantified compared to actin. The amount of Nrf2 before addition of CHX was set as 1. Blot shown is a representative experiment. Graph shows the results as mean ± S.E. of 3 determination. * p<0.05, ** p<0.01, significantly different from its corresponding c-Myc-siRNA.

Similar articles

Cited by

References

    1. Nilsson JA, Cleveland JL. Myc pathways provoking cell suicide and cancer. Oncogene. 2003;22(56):9007–9021. - PubMed
    1. Nesbit CE, Tersak JM, Prochownik EV. MYC oncogenes and human neoplastic disease. Oncogene. 1999;18(19):3004–3016. - PubMed
    1. Blackwell TK, Huang J, Ma A, Kretzner L, Alt FW, Eisenman RN, Weintraub H. Binding of myc proteins to canonical and noncanonical DNA sequences. Mol Cell Biol. 1993;13(9):5216–5224. - PMC - PubMed
    1. Dang CV, Resar LM, Emison E, Kim S, Li Q, Prescott JE, Wonsey D, Zeller K. Function of the c-Myc oncogenic transcription factor. Exp Cell Res. 1999;253(1):63–77. - PubMed
    1. Dang CV. c-Myc target genes involved in cell growth, apoptosis, and metabolism. Mol Cell Biol. 1999;19(1):1–11. - PMC - PubMed

Publication types

MeSH terms

LinkOut - more resources