Review
. 2010 May 12;110(5):2685-708.
doi: 10.1021/cr900267p.

Fluorescence polarization/anisotropy in diagnostics and imaging

Affiliations
Review

Fluorescence polarization/anisotropy in diagnostics and imaging

David M Jameson et al. Chem Rev. .
No abstract available


Figures

Figure 1
Figure 1
Gregorio Weber in Hawaii – 1989. Photograph courtesy of Prof. David Jameson.
Figure 2
Figure 2
Photo of George Gabriel Stokes (retrieved on July 26, 2009 from http://commons.wikimedia.org/wiki/File:Stokes_George_G.jpg) and the first page of his famous manuscript. Reprinted with permission from Reference 8. Copyright 1852 The Royal Society.
Figure 3
Figure 3
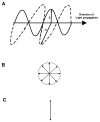
(A) Sketch depicting oscillations of the electric (E) and magnetic (H) fields for a propagating electromagnetic wave. Orientation of the electric field in natural/unpolarized light (B) and vertically polarized light (C).
Figure 4
Figure 4
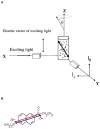
(A) Illustration of the relative axes of the laboratory coordinate system showing the orientation of the electric field vector of the excitation light and the relative orientations of the excitation and emission polarizer, and the angle of the rotating molecules with respect to the z axis (θ). (B) Chemical structure of PRODAN showing the absorption (blue) and emission (red) dipole moments.
Figure 5
Figure 5
Illustration of the photoselection of a randomly oriented distribution of fluorophores by vertically polarized light and their subsequent rotational Brownian diffusion.
Figure 6
Figure 6
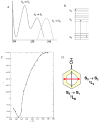
(A) Excitation and emission spectra, (B) Perrin-Jabłoński energy level diagram (C) excitation polarization spectrum, and (D) chemical structure illustration of the orientations of the 1Lb and 1La (S0 → S1 and S0 → S2) electronic transitions of phenol. Reprinted with permission from Reference 16. Copyright 1966 John Wiley & Sons Inc.
Figure 7
Figure 7
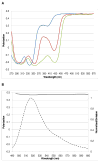
(A) Excitation polarization spectra of Rhodamine 123 (Rh 123, blue), Rhodamine B – methyl ester (Rh B-Me, red) and tetramethylrhodamine–maleimide reacted with free cysteine (TMR, green) in glycerol pH 7 at 2°C. (B) Emission intensity (dashed) and emission polarization scan (solid) of fluorescein, excited at 480nm, in glycerol with 0.01M NaOH at 2°C.
Figure 8
Figure 8
Illustration of the rotation of a fluorophore free in solution as compared to a fluorophore attached to a protein or macromolecule. As indicated in the figure, the fluorophore free in solution can rotate rapidly (compared to its fluorescence lifetime) and hence gives rise to a low polarization value whereas a fluorophores attached to a protein (either covalently or non-covalently) will rotate more slowly (relative to its fluorescence lifetime) due to the larger mass of the macromolecule and hence give rise to a high polarization.
Figure 9
Figure 9
Perrin-Weber plot of a labeled spherical protein of 25kDa with no local motion of a 4.0 ns probe (dashed line) and with 40% of the anisotropy due to rapid local probe motion (solid line). The P0 can be determined from the y-axis intercept.
Figure 10
Figure 10
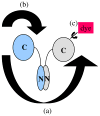
Illustration of different rotational modalities of a fluorescently labeled protein showing (a) global protein motion, (b) protein subunit flexibility and (c) local probe motion.
Figure 11
Figure 11
Binding isotherm of mant-GTPγS (a slowly hydrolyzable GTP analogue) to the large GTPase dynamin. The enhancement of the fluorescence of the mant-GTPγS upon binding was approximately 2 fold and the Kd was determined to be 8.3 μM. If one were to ignore the enhancement of the mant-GTPγS, the Kd would erroneously be determined as 2.5 μM. Reprinted with permission from Reference 44. Copyright 2005 Elsevier.
Figure 12
Figure 12
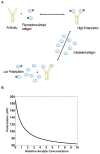
(A) Scheme of a fluorescent immunoassay. An antibody and fluorescently labeled antigen are mixed and allowed to equilibrate, then the unlabeled analyte or antigen is added which displaces the labeled antigen resulting in a lower polarization. (B) Plot depicting a fluorescence polarization immunoassay; the free ligand has a polarization of 50 mP while the bound ligand has a polarization of 190 mP.
Figure 13
Figure 13
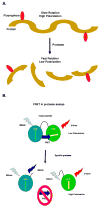
(A) Illustration of typical protease assay where the polarization decreases following proteolysis. (B) Illustration of a DARET assay in which the polarization is initially low due to FRET from the photoselected Blue Fluorescent Protein (BFP) to the Green Fluorescent Protein (GFP) acceptor; the polarization increases following proteolysis due to the direct photoselection and excitation of the GFP.
Figure 14
Figure 14
Diagram of light rays emitted from a lens focused on a sample with half-angle θ. Arrows indicate the orientation of the electric field vector of the incident light.
Figure 15
Figure 15
Steady state fluorescence polarization images of FITC-Calmodulin in serum starved fibroblasts - from. (A) Before stimulation and (B) 60 s, (C) 90 s and (D) 120 s following stimulation with media containing serum. Color bar represents measured anisotropy from 0.25 (red) to 0.05 (blue). Reprinted with permission from Reference 121. Copyright 1993 the Rockefeller University Press. (E) Total intensity image and (F) anisotropy image of Actin filaments labeled with AlexaFluor488-phalloidin in the Drosophila eye. The anisotropy images, acquired on a LSM 710 with anisotropy option, are courtesy of Otto Baumann from the University of Potsdam, and Robert Hauschild, Eva Simbürger and Oliver Holub from Carl Zeiss MicroImaging GmbH.
Figure 15
Figure 15
Steady state fluorescence polarization images of FITC-Calmodulin in serum starved fibroblasts - from. (A) Before stimulation and (B) 60 s, (C) 90 s and (D) 120 s following stimulation with media containing serum. Color bar represents measured anisotropy from 0.25 (red) to 0.05 (blue). Reprinted with permission from Reference 121. Copyright 1993 the Rockefeller University Press. (E) Total intensity image and (F) anisotropy image of Actin filaments labeled with AlexaFluor488-phalloidin in the Drosophila eye. The anisotropy images, acquired on a LSM 710 with anisotropy option, are courtesy of Otto Baumann from the University of Potsdam, and Robert Hauschild, Eva Simbürger and Oliver Holub from Carl Zeiss MicroImaging GmbH.
Figure 16
Figure 16
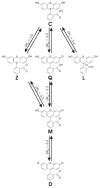
Chemical structures of the various prototropic forms of fluorescein showing the pKa of each transition. C - cation; Z – zwitterion; Q – quinoid; L – lactone; M – monoanion; D – dianion.
Figure 17
Figure 17
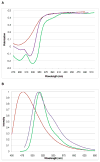
(A) Excitation polarization spectra and (B) emission spectra of fluorescein in 0.01M NaOH (green), 0.01M HCl (red) and 0.01M MES buffer pH6 (purple) at 2 °C in glycerol.
Figure 18
Figure 18
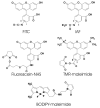
Chemical structures of commonly used reactive probes; fluorescein-isothiocyanate (FITC), Iodoacetamido-fluorescein (IAF), Fluorescein N-hydroxysuccinimidyl ester (Fluorescein-NHS), tetramethylrhodamine-maleimide (TMR-maleimide) and BODIPY-maleimide.
Figure 19
Figure 19
Excitation polarization spectra of fluorescein-isothiocyanate (FITC) (blue), Iodoacetamido-fluorescein (IAF) (red) and Green Fluorescent Protein (GFP) (green) in glycerol at 2°C.
Figure 20
Figure 20
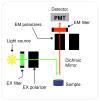
Diagram of a typical fluorescence polarization plate reader, showing the light source, sample, detector and, excitation and emission filters and polarizers. Image courtesy of Xavier Amouretti and Bio Tek Instruments, Inc.

Similar articles

Cited by

References

    1. Weber G. Biochem J. 1952;51:145. - PMC - PubMed
    1. Weber G. Biochem J. 1952;51:155. - PMC - PubMed
    1. Jameson DM. In: New Trends in Fluorescence Spectroscopy. Valeur B, Brochon JC, editors. Springer; Heidelberg: 2001.
    1. Malus EL. Nouveau Bull de la Societé Philomatique. 1809;1:266.
    1. Brewster D. Philos Trans R Soc London. 1830;2:387.

Publication types

MeSH terms

Substances