. 2010 Jun;27(6):725-39.
doi: 10.1080/073911010010524943.

DNA architecture, deformability, and nucleosome positioning

Affiliations

DNA architecture, deformability, and nucleosome positioning

Fei Xu et al. J Biomol Struct Dyn. 2010 Jun.

Abstract

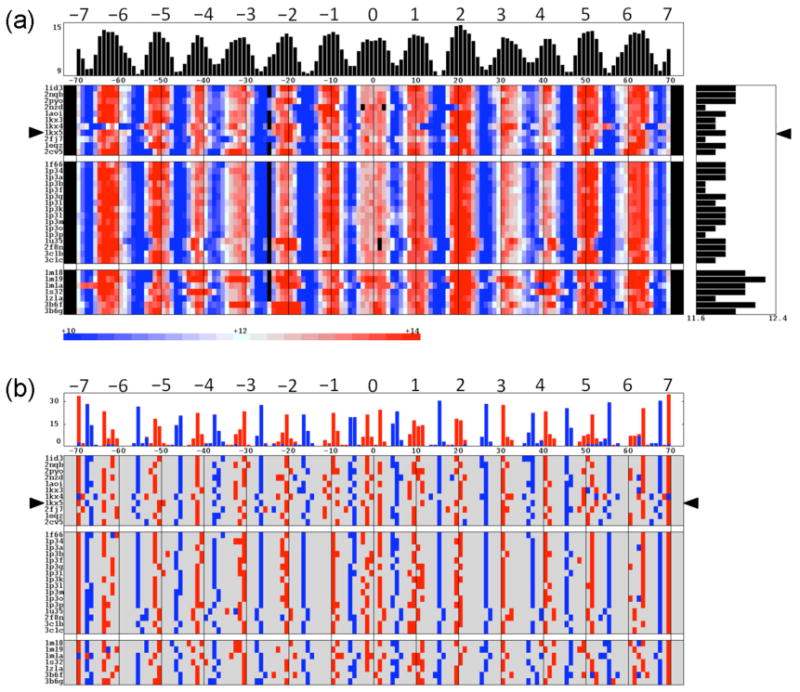
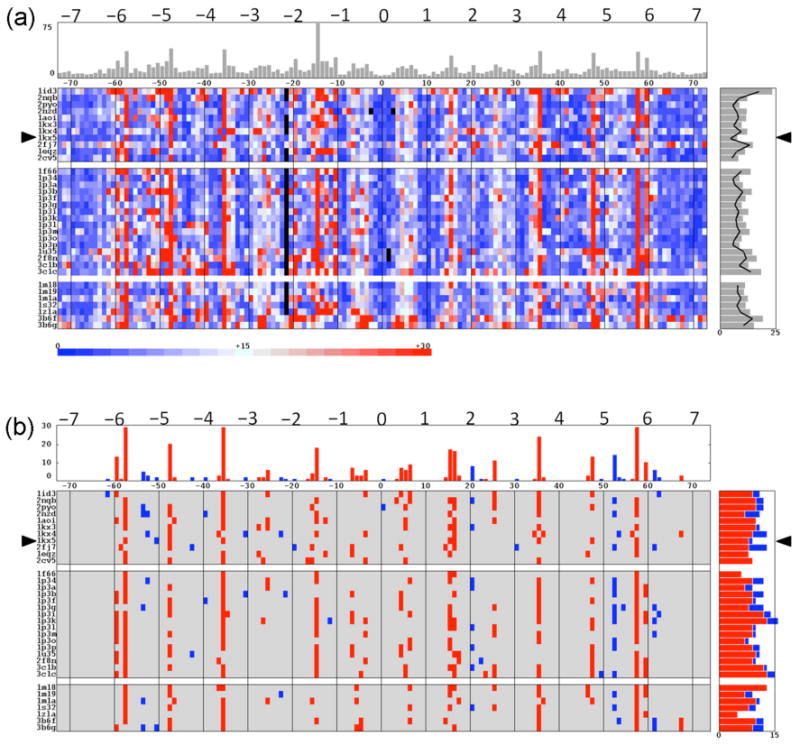
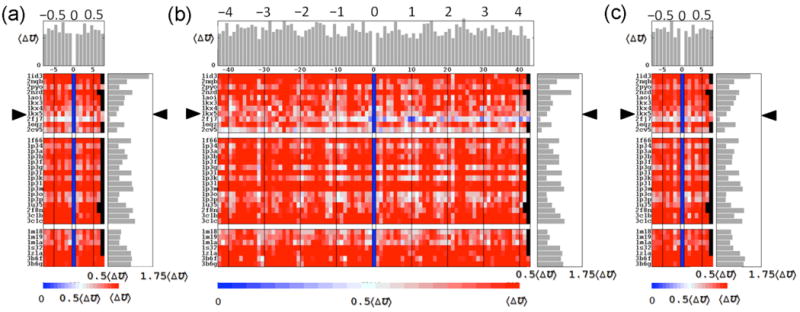
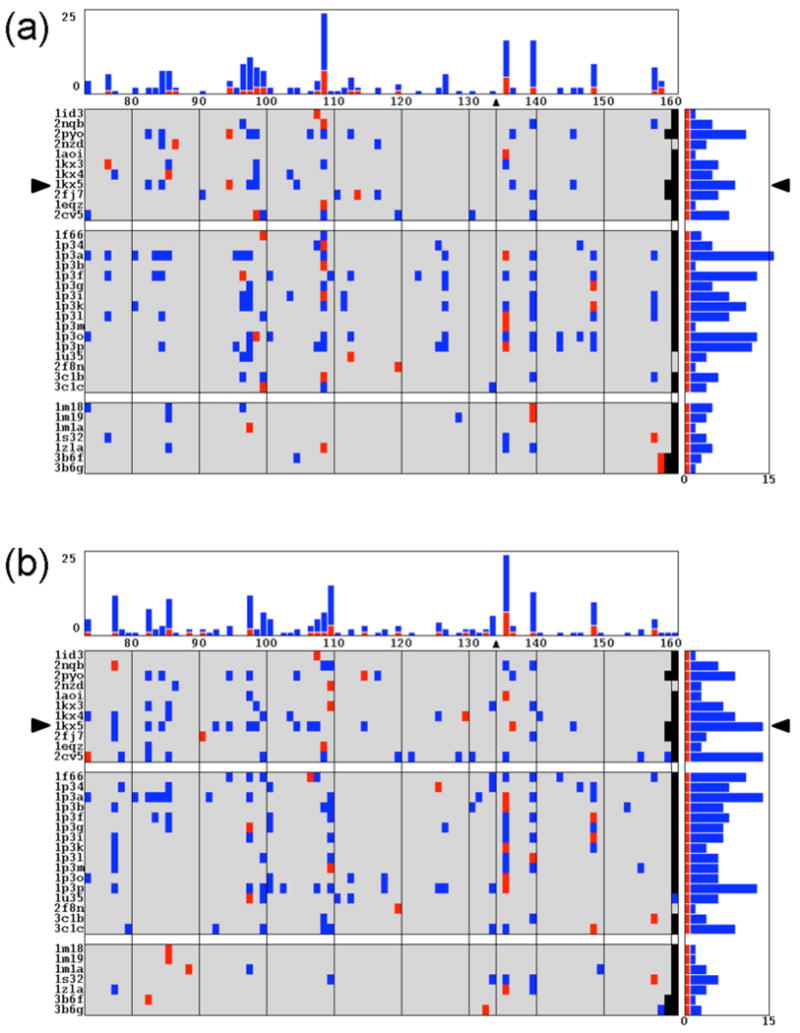
The positioning of DNA on nucleosomes is critical to both the organization and expression of the genetic message. Here we focus on DNA conformational signals found in the growing library of known high-resolution core-particle structures and the ways in which these features may contribute to the positioning of nucleosomes on specific DNA sequences. We survey the chemical composition of the protein-DNA assemblies and extract features along the DNA superhelical pathway - the minor-groove width and the deformations of successive base pairs - determined with reasonable accuracy in the structures. We also examine the extent to which the various nucleosome core-particle structures accommodate the observed settings of the crystallized sequences and the known positioning of the high-affinity synthetic '601' sequence on DNA. We 'thread' these sequences on the different structural templates and estimate the cost of each setting with knowledge-based potentials that reflect the conformational properties of the DNA base-pair steps in other high-resolution protein-bound complexes.


Figures

Figure 1
Figure 1
Color-coded representation of the DNA sequences crystallized in known nucleosome core-particle structures (2-20). The Protein Data Bank identifiers (PDB_IDs) of individual structures are noted on the left in the same order as in Table 1, with the entry for the currently best-resolved structure (1kx5) highlighted by triangles. Nucleotide positions are reported with respect to the central base pairs of the crystallized 147-bp sequences at position 0. The small numerals above the mosaic denote the base-pair position, and the large numerals above the canonical B-DNA structure show the superhelical position, i.e., the approximate number of helical turns of a given base pair from the dyad (2). The double-helical image shows the relative orientation of the base pairs and the directions of the major/minor grooves at each sequential position — e.g., the long axis of the base-pair points toward the viewer, the major groove faces downward, and the minor groove faces upward at the dyad and all other integral superhelical positions. Nucleotide content in individual structures is depicted on the right with the same color-coding as that along individual sequences. The ‘missing’ bases in nucleosomes that bind 145- and 146-bp DNA fragments are represented in black and positioned to maximize the alignment of the sequences with the bases in the 147-bp chains. Overrepresented dinucleotide steps include AA·TT, AT·AT, and CA·TG. Underrepresented dimers include CG·CG, AC·GT, TA·TA, and GG·CC. Image does not include the bases in the most recently solved core-particle structure (21), with DNA identical in sequence to that in the one other nucleosome binding a 145-bp piece of DNA (17). See Table 1 for details of nucleosome composition and resolution.
Figure 2
Figure 2
Sequential variation of (a) the DNA minor-groove width and (b) the sites of local maxima and minima in these values, i.e., points that distinguish the inner vs. outer surface of the bound DNA, in high-resolution nucleosome core-particle structures. The color-coded range in (a) corresponds to values within two standard deviation of the average minor-groove width, 12±2 Å, over all structures. Data are plotted with respect to base-pair position, with the conformational parameters of the dimer steps that incorporate a given base pair depicted by color-coded blocks on either side of the designated point. ‘Phantom’ dinucleotide steps are inserted in the 145- and 146-bp histone-bound DNAs to maximize the alignment of groove dimensions. The same alignment is used but not depicted in (b). Mean values and the number of (blue) maxima or (red) minima in groove width at particular locations along the dyad are respectively reported in the histograms at the top of the images. Mean values of minor-groove width in individual structures are plotted to the right in (a). Data are presented in the same order and with the same notation as in Figure 1 and Table 1.
Figure 3
Figure 3
Deformation scores of (a) the base-pair steps of a generic mixed-sequence DNA threaded on the molecular pathways adopted in known nucleosome structures and (b) the sites of high-scoring kink-and-slide deformations (23) found therein. The color-coded range in (a) corresponds to energy values within one standard deviation of the average deformation score, 15±15, over all structures. Kink-and-slide states are grouped into two categories, A-like in blue and C-like in red, based upon the directions and magnitudes of local bending and shearing. Data are plotted, as in Figure 2, with respect to the structural dyad and with ‘phantom’ base-pair steps introduced to maximize the alignment of high and low scoring regions across all structures. The same alignment is used but not depicted in (b). Mean scores and number of kink-and-slide states at specific base-pair steps are respectively noted at the top of the images. Corresponding values in individual structures are plotted to the right of each image. The mean sequence-dependent deformation scores of the base-pair steps that make up each nucleosome are represented in (a) by the points on the right connected by a solid line. See text and legend to Figure 2 for numerical criteria and other details.
Figure 4
Figure 4
Cost of threading crystallized DNA sequences on the spatial pathway adopted in known nucleosome structures. The structural template in (a,c) is shortened to 130 base-pair steps by removing straight, 8-bp pieces from either end of the superhelical pathway. This allows for 15-17 different settings of the sequence fragment on the 145-147-bp structural templates. The template in (b) is reduced to the central 60-bp steps in contact with the (H3·H4)2 tetramer, with the number of characterized settings thereby increased to 85-87. The shift of one setting relative to the natural setting 0 is reported along the abscissa, and the identities of the structures are noted along the ordinate. The threading scores along the DNA pathway in the best-resolved nucleosome structure (1kx5) are highlighted by triangles. The total deformation scores of chain fragments are scaled with respect to the average deviation 〈ΔU〉 from the score of the minimum-energy setting in each structure. Mean scores of individual settings are reported in the histograms at the top of the images. Corresponding averages over all settings of a given template are plotted to the right of each image. Omitted settings are denoted in black. The ‘energies’ in (a,b) are based on elastic potentials recently derived from the rigid-body parameters relating successive base pairs in a non-redundant set of high-resolution protein-DNA crystal structures (24) and those in (c) with an earlier set of parameters extracted of necessity from a fewer crystal complexes without considerations of structural resolution or redundancy (26). See legend to Figure 2.
Figure 5
Figure 5
Profiles of the low-energy settings of a synthetic 232-bp fragment bearing the high-affinity 601 nucleosome-positioning sequence. Total deformation scores, obtained by threading the sequence on structural templates made up of the 145-147 bp of DNA in known crystal structures, are compared against the observed setting mapped with single-nucleotide resolution at base pair 134 (45). The 88-86 settings of the sequence are described along the abscissa by the identity of the base pair on the structural dyad, and the structural templates are listed along the ordinate. The experimentally observed setting is highlighted by a triangle at the top of the rectangular grid and enclosed by parallel lines. Color-coded entries distinguish the minimum-energy settings (red) and the settings of competing secondary minima (blue) found for each template. The number of low-energy states associated with each setting is reported in the histogram at the top of image, and the corresponding number found for a given structural template in the histogram on the right. The secondary minima are selected on the basis of the relative deformation score, with values less than 0.25〈ΔU〉. The ‘energies’ in (a) are computed with a recently reported set of elastic potentials (24) and those in (c) with an older set (26). See Figure 4 and the text for the definition of 〈ΔU〉 and other details.

Similar articles

Cited by

References

    1. Kornberg RD, Lorch Y. Cell. 1999;98:285–294. - PubMed
    1. Luger K, Mäder AW, Richmond RK, Sargent DF, Richmond TJ. Nature. 1997;389:251–260. - PubMed
    1. Berman HM, Westbrook J, Feng Z, Gilliland G, B TN, Weissig H, Shindyalov IN, Bourne PE. Nucleic Acids Res. 2000;28:235–242. - PMC - PubMed
    1. Harp JM, Hanson BL, Timm DE, Bunick GJ. Acta Crystallographica Section D - Biological Crystallography. 2000;56:1513–1534. - PubMed
    1. Suto RK, Clarkson MJ, Tremethick DJ, Luger K. Nature Structural Biology. 2000;7:1121–1124. - PubMed

Publication types

LinkOut - more resources