. 2010 Aug;8(4):427-36.
doi: 10.1089/adt.2009.0250.

Screening for small molecules' bilayer-modifying potential using a gramicidin-based fluorescence assay

Affiliations

Screening for small molecules' bilayer-modifying potential using a gramicidin-based fluorescence assay

Helgi I Ingólfsson et al. Assay Drug Dev Technol. 2010 Aug.

Abstract

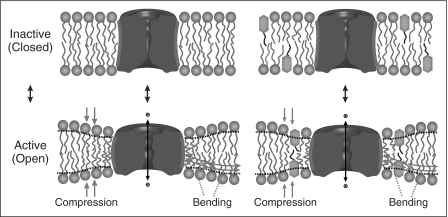
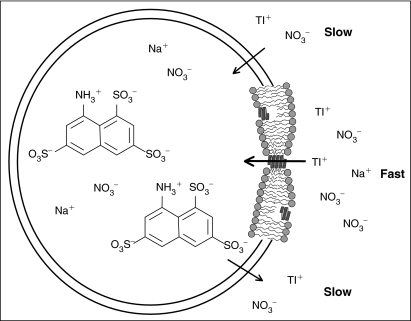
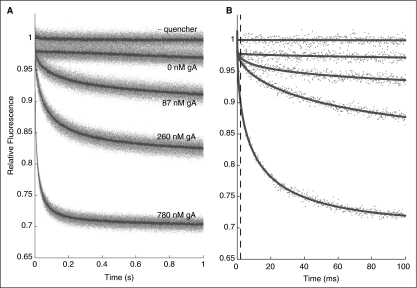
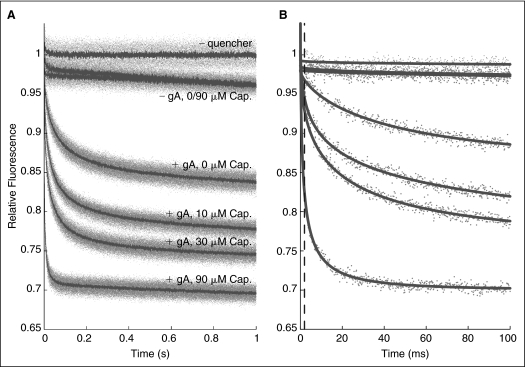
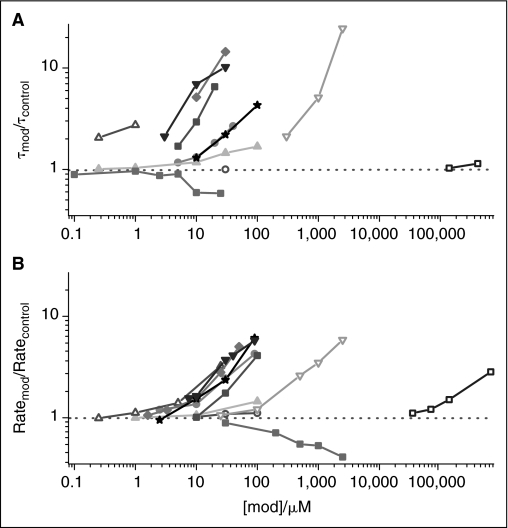
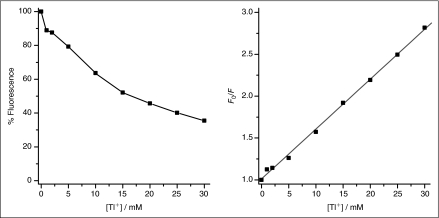
Many drugs and other small molecules used to modulate biological function are amphiphiles that adsorb at the bilayer/solution interface and thereby alter lipid bilayer properties. This is important because membrane proteins are energetically coupled to their host bilayer by hydrophobic interactions. Changes in bilayer properties thus alter membrane protein function, which provides a possible mechanism for "off-target" drug effects. We have previously shown that channels formed by the linear gramicidins are suitable probes for changes in lipid bilayer properties, as experienced by bilayer-spanning proteins. We now report a gramicidin-based fluorescence assay for changes in bilayer properties. The assay is based on measuring the time course of fluorescence quenching in fluorophore-loaded large unilamellar vesicles, due to entry of a gramicidin channel-permeable quencher. The method is scalable and suitable for both mechanistic studies and high-throughput screening for bilayer-perturbing, potential off-target effects, which we illustrate using capsaicin (Cap) and other compounds.


Figures

Fig. 1.
Fig. 1.
Amphiphiles can alter protein function without binding to the protein. The hydrophobic coupling between membrane proteins and their host bilayer provides for energetic coupling of the protein conformational preference to bilayer material properties, as the bilayer adjusts to the changes in protein conformation. The figure illustrates this for an ion channel, where the closed and open states have different hydrophobic lengths. The associated bilayer deforming energy will contribute to the equilibrium distribution between the states. Because amphiphiles can alter the bilayer material properties (compression and/or bending moduli), they can alter protein function without binding to the protein.
Fig. 2.
Fig. 2.
A fluorophore-loaded large unilamellar vesicle (LUV) doped with gramicidin A (gA) and exposed to quencher. Illustrated here with the 8-aminonaphthalene-1,3,6-trisulfonate (ANTS)/Tl+ fluorophore/quencher pair. Tl+ and ANTS cross the lipid bilayer poorly, whereas gA channels are Tl+ permeable. The rate of Tl+ influx into the vesicle, and the rate of fluorescence quenching, is proportional to the number of (bilayer-spanning) conducting gA channels in the LUV. The “expanded” view to the right shows a lipid bilayer segment with the 2 major gA forms: nonconducting monomer and conducting dimers.
Fig. 3.
Fig. 3.
Fluorescence quenching in the absence and presence of gramicidin A (gA). Relative fluorescence signal obtained with 8-aminoaphthalene-1,3,6-trisulfonate (ANTS)-filled vesicles shown (from top to bottom): without quencher, with quencher, and with quencher and doped with 87, 260, and 780 nM gA. (A) One second traces; gray dots denote results from all individual repeats (n > 5 per condition); red lines denote the average of all repeats. (B) One hundred milliseconds traces; gray dots are from a single repeat for each condition; red lines are stretched exponential fits (2–100 ms) to those repeats. The stippled blue line denotes the 2 ms mark, the time at which the rate of quenching is determined.
Fig. 4.
Fig. 4.
Effect of capsaicin (Cap) on the time course of 8-aminonaphthalene-1,3,6-trisulfonate (ANTS) fluorescence quenching. (A) Normalized fluorescence signal over 1 s, gray dots denote results from all repeats (n > 5 per condition); red lines denote the average of all repeats. (B) The first 100 ms, gray dots denote results from a single repeat for each condition; red lines are stretched exponential fits (2–100 ms) to those repeats. The stippled line denotes the 2 ms mark, the time at which the rate of quenching is determined. In both (A) and (B), the top trace shows results in the absence of Tl+; the next 2 traces show results in the absence of gramicidin A (gA), with Tl+ ± Cap; the 4 lower traces show results with 260 nM gA and Tl+, where the numbers denote [Cap] in μM. The rates of quenching for 0, 10, 30, and 90 μM Cap, as determined by the rate of a stretched exponential (see Materials and Methods), are 36 ± 6, 69 ± 6, 85 ± 8, and 247 ± 27 (mean ± s.d., n > 8), respectively.
Fig. 5.
Fig. 5.
Comparison to single-channel method. (A) The relative change in gramicidin A (gA) single-channel lifetime (τ) as function of modifier concentration ([mod]). For modifiers: β-OG (-▿-), capsaicin (-★-), capsazepine (-♦-), DMSO (-□-), EC (-▴-), EGCG (-▵-), Gd3+ (-▪-), genistein (-•-), genistin (-○-), mefloquine (-▪-), and Triton X-100 (-▴-). Electrophysiological data from refs. –,,, as well as unpublished results by Shemille A. Collingwood, DMSO, Tashalee R. Brown, Gd3−, and E. Ashley Hobart, mefloquine. (B) The relative change in the rate of fluorescence quench (Tl+ influx rate) as a function of the same [mod].
Appendix Fig. 1.
Appendix Fig. 1.
The Stern–Volmer quenching constant (K), F0/F = 1 + K [Tl+], was determined to be 60 M−1 by fitting a straight line to F0/F vs. [Tl+]. The experimental conditions were 200 μM 8-aminonaphthalene-1,3,6-trisulfonate (ANTS) in the presence and absence of 0–30 mM TlNO3 and an electrolyte solution with fixed ionic strength of 150 mM, maintained by varying amounts of NaNO3 plus 10 mM HEPES (pH 7.0).

Similar articles

Cited by

References

    1. Lipinski CA. Lombardo F. Dominy BW. Feeney PJ. Experimental and computational approaches to estimate solubility and permeability in drug discovery and development settings. Adv Drug Deliv Rev. 1997;23:3–26. - PubMed
    1. Leeson PD. Springthorpe B. The influence of drug-like concepts on decision-making in medicinal chemistry. Nat Rev Drug Discov. 2007;6:881–890. - PubMed
    1. Keserü GM. Makara GM. The influence of lead discovery strategies on the properties of drug candidates. Nat Rev Drug Discov. 2009;8:203–212. - PubMed
    1. Waring MJ. Defining optimum lipophilicity and molecular weight ranges for drug candidates-Molecular weight dependent lower logD limits based on permeability. Bioorg Med Chem Lett. 2009;19:2844–2851. - PubMed
    1. Evans E. Rawicz W. Hofmann AF. Lipid bilayer expansion and mechanical disruption in solutions of water-soluble bile acid. In: Hofmann AF, editor; Paumgartner G, editor; Stiehl A, editor. Bile Acids in Gastroenterology: Basic and Clinical Advances. Kluwer Academic Publishers; Dordrecht: 1995. pp. 59–68.

Appendix References

    1. Berberan-Santos MN. Bodunov EN. Valeur B. Mathematical functions for the analysis of luminescence decays with underlying distributions 1. Kohlrausch decay function (stretched exponential) Chem Phys. 2005;315:171–182.
    1. Avdeef A. Physicochemical profiling (solubility, permeability and charge state) Curr Top Med Chem. 2001;1:277–351. - PubMed
    1. Seydel JK. Wiese M. Drug-Membrane Interactions: Analysis, Drug Distribution, Modeling. Wiley-VCH; Weinheim, Germany: 2002.
    1. Søgaard R. Werge TM. Bertelsen C. Lundbye C. Madsen KL. Nielsen CH, et al. GABAA receptor function is regulated by lipid bilayer elasticity. Biochemistry. 2006;45:13118–13129. - PubMed
    1. Bruno MJ. Koeppe RE., II Andersen OS. Docosahexaenoic acid alters bilayer elastic properties. Proc Natl Acad Sci USA. 2007;104:9638–9643. - PMC - PubMed

Publication types

LinkOut - more resources