. 2010 Apr;76(2):273-85.
doi: 10.1111/j.1365-2958.2010.07112.x. Epub 2010 Mar 10.

Gene position in a long operon governs motility development in Bacillus subtilis

Affiliations

Gene position in a long operon governs motility development in Bacillus subtilis

Loralyn M Cozy et al. Mol Microbiol. 2010 Apr.

Abstract

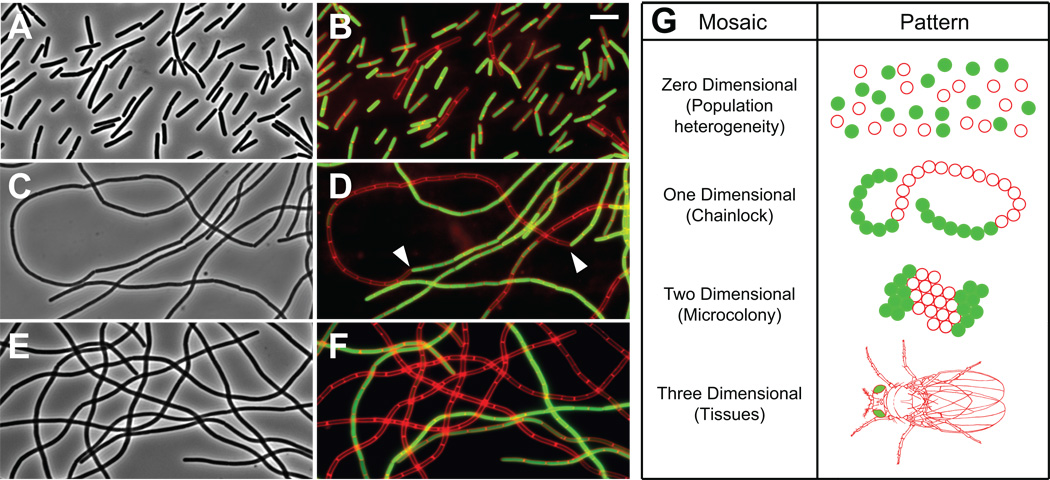
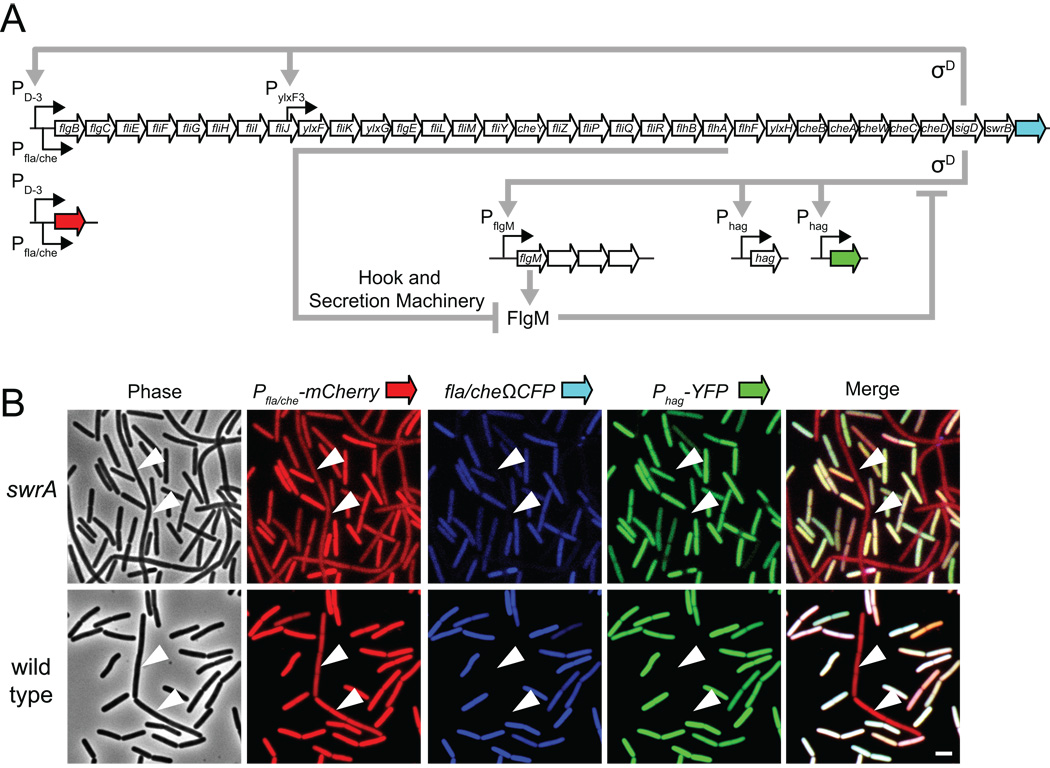
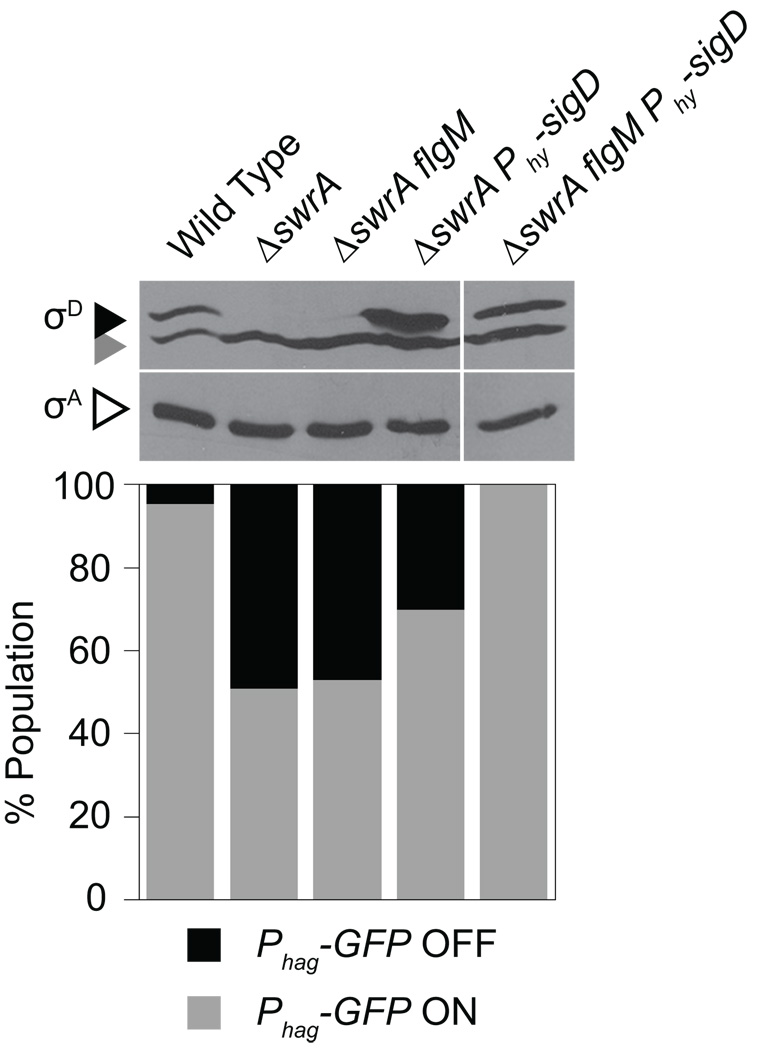
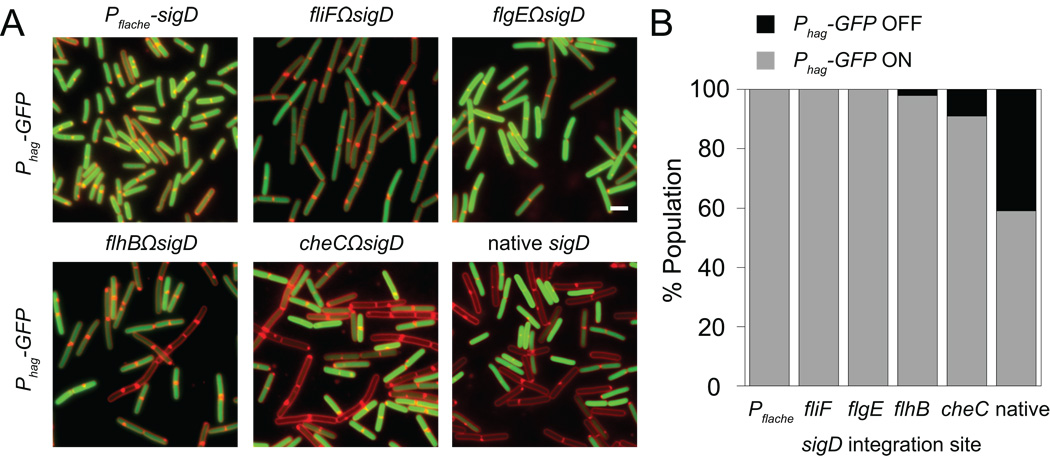
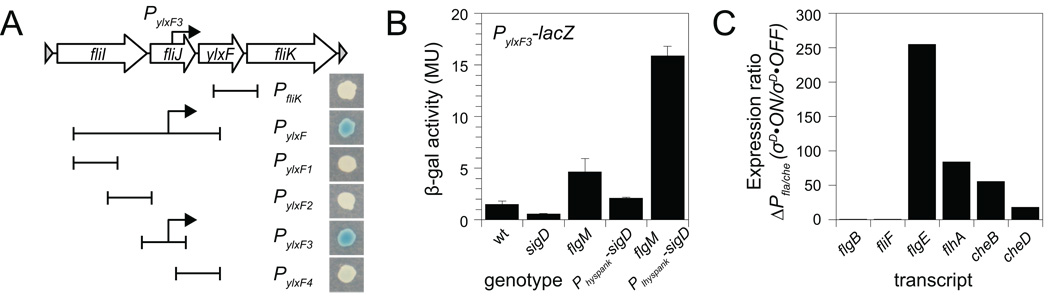
Growing cultures of Bacillus subtilis bifurcate into subpopulations of motile individuals and non-motile chains of cells that are differentiated at the level of gene expression. The motile cells are ON and the chaining cells are OFF for transcription that depends on RNA polymerase and the alternative sigma factor sigma(D). Here we show that chaining cells were OFF for sigma(D)-dependent gene expression because sigma(D) levels fell below a threshold and sigma(D) activity was inhibited by the anti-sigma factor FlgM. The probability that sigma(D) exceeded the threshold was governed by the position of the sigD gene. The proportion of ON cells increased when sigD was artificially moved forward in the 27 kb fla/che operon. In addition, we identified a new sigma(D)-dependent promoter that increases sigD expression and may provide positive feedback to stabilize the ON state. Finally, we demonstrate that ON/OFF motility states in B. subtilis are a form of development because mosaics of stable and differentiated epigenotypes were evident when the normally dispersed bacteria were forced to grow in one dimension.


Figures

Figure 1
Figure 1. Epigenesis produces a mosaic of gene expression
Growing populations of B. subtilis containing a σD-dependent transcriptional reporter (amyE::Phag-GFP) in wild type DS908 (panels A and B), lytABCDF DS2447 (panels C and D), and swrA lytABCDF DS3250 (panels E and F). Cells were observed using phase contrast (panels A, C, and E) and epifluorescence microscopy (panels B, D, and F). Membranes were false colored in red, Phag-GFP was false colored in green. Carets indicate adjacent ON/OFF cells in a single chain. Size bar is 4 µm. G) Cartoon of the mosaic pattern of cells growing under various spatial constraints. Green dots represent cells in an ON state. Red circles represent cells in an OFF state. Mosaic microcolonies formed when heterogeneous expression of the sporulation genes in B. subtilis or the galactose utilization pathway in Saccharomyces cerevisiae was constrained in two dimensions (Kaufmann et al., 2007; Veening et al., 2008b). A multicellular organism is a three dimensional mosaic of gene expression. For example, green eyes of the Drosophila cartoon represent differential expression of the eyeless gene in a subset of tissues (Halder et al.,, 1998).
Figure 2
Figure 2. Isogenic chains and single cells contain different levels of σD protein
A) A mixed population of chains and single cells from DS1708 were lysed, proteins were separated by SDS-PAGE and probed by Western blot with anti-σD antibody. Cell type separation was used to enrich for single motile cells and non-motile chains that were analyzed similarly by Western blot. Dark caret indicates σD protein. Grey caret indicates an unknown cross-reacting band seen constitutively in all samples that serves as a loading control. Phase contrast microscopy panel above each lane depicts the cellular composition of each fraction. B) A heterogeneous population of chains and single cells mutant for swrA carrying the σD-dependent transcriptional reporter Phag-YFP (DS1708) was applied to the top of a Percoll density gradient column and centrifuged, resulting in the separation of the two cell types. Each fraction was observed using epifluorescence microscopy with membranes false colored in red and YFP false colored in green. Size bar is 20 µm.
Figure 3
Figure 3. Expression of the sigD gene within the fla/che operon is heterogeneous
A) The genetic organization of the fla/che operon and σD-dependent genes. Transcription of Pfla/che is directed by the σA form of RNA polymerase. The penultimate gene of the operon, sigD, encodes σD which directs RNA polymerase to transcribe σD-dependent promoters including Phag, PflgM, PD-3 and PylxF3. FlgM is an anti-sigma factor that inhibits σD directed transcription. The secretion apparatus encoded by the fla/che operon, inhibits the activity of FlgM (Hughes et al., 1993; Fig S1). Block arrows represent open reading frames (not to scale). Bent black arrows represent promoters. Grey arrows indicate activation. Grey T-bars indicate repression. The red arrow indicates the location of mCherry, the blue arrow indicates the location of CFP, and the green arrow indicates the location of YFP in the experiment in panel B. B) Three fluorescent transcriptional reporters Pfla/che-mCherry (false color red), fla/cheΩCFP (false color blue) and Phag-YFP (false color green) were introduced into either a swrA background (DS3160) or a wild type backround (DS3139) and observed by epifluorescence microscopy. Carets indicate the location of a chain. Scale bar is 2 µm.
Figure 4
Figure 4. Transcript levels decrease along the fla/che operon and sigD transcript levels are low in OFF cells
RNA was purified separately from enriched single cells (ON, closed circles) and enriched chains (OFF, open circles) of a swrA mutant (DS1708) and used as a template for quantitative reverse transcriptase PCR. The dots on the graph correspond to transcript levels of the indicated genes from left to right: flgB, fliF, flgE, fliZ, flhA, cheD, sigD at their respective distances from the Pfla/che promoter, expressed relative to the constitutively expressed sigA gene (Gitt et al., 1985). Dotted line is included for comparison of relative transcript levels. Gray carets indicate the locations of the Pfla/che promoter, the newly identified PylxF3 promoter, and the sigD gene.
Figure 5
Figure 5. The entire population is activated for flagellin expression only when sigD is overexpressed and flgM is mutated
Top) Proteins from cell lysates of the indicated genotype were separated by SDS-PAGE and probed by Western blot with either anti-σD antibody or anti-σA antibody. Dark caret indicates σD protein. Grey caret indicates an unknown cross-reacting band seen constitutively in all samples. Open caret indicates σA levels that serve as a loading control. Bottom) Percent population in the Flagellin-ON (grey bar) or Flagellin-OFF (black bar) state was determined by dividing number of cells expressing Phag-GFP by total cells in a field. Greater than 600 cells were scored to generate each bar. The genotype of each bar corresponds vertically to the lanes immediately above in panels (DS908, DS4015, DS4034, DS4035, DS4039) and IPTG was included at 1 mM during growth during the preparation of all samples.
Figure 6
Figure 6. The position of the sigD gene determines the ON/OFF frequency in heterogeneous populations
The sigD gene was integrated at various points along the fla/che operon in a background that contained the transcriptional reporter Phag-GFP and was mutated for swrA, flgM and native sigD genes (DS5327, DS5328, DS5329, DS4034, DS5124, DS5326). The swrA mutation was included to set the ON/OFF bias close to 50% for comparing meaningful changes in expression. The flgM mutation was necessary to abolish σD inhibition when the flagellar basal body was disrupted (Fig S1) but did not bias the population itself (Fig 5). The native sigD gene was mutated to prevent merodiploid effects when sigD was integrated at non-native sites. A) Cells were observed using epifluorescence microscopy. Membranes were false colored in red. Phag-GFP was false colored in green. Size bar is 2 µm. B) The percent of the population in the flagellin-ON (grey bar) or flagellin-OFF (black bar) state was determined by dividing the number of cells expressing Phag-GFP by the total cells in a field. The sigD gene was integrated downstream of the fliF, flgE, flhA, and cheC genes or fused directly the Pfla/che promoter. At least 600 cells were counted per strain.
Figure 7
Figure 7. A σD-dependent promoter is located within thefla/cheoperon
A) Map of the region of the fla/che operon that contains the σD-dependent promoter PylxF3. Block arrows represent open reading frames. Bent arrows represent promoters. Double T-bars represent regions of DNA transcriptionally fused to a lacZ reporter. Cells containing the following transcriptional fusions: PfliK-lacZ (DS5675), PylxF-lacZ (DS5577), PylxF1-lacZ (DS5765), PylxF2-lacZ (DS5766), PylxF3-lacZ (DS5767), PylxF4-lacZ (DS5768), were plated on media containing the chromogenic substrate, X-gal, incubated overnight at 37°C and photographed. Each strain was enchanced for σD activity by simultaneous mutation of FlgM and overexpression of sigD by the IPTG-inducible Physpank-sigD construct and growth in the presence of 1 mM IPTG. B) β-galactosidase assays of PylxF3-lacZ transcriptional activity were conducted in the indicated genetic backgrounds and expressed in Miller Units. Error bars are the standard deviation of three replicates. The following strains were used to generate this panel: wild type (DS5717), sigD (DS5798), flgM (DS5724), Physpank-sigD (DS5755), and flgM Physpank-sigD (DS5767). C) Transcript abundance of points in the fla/che operon in a strain deleted for PD-3 and Pfla/chePD-3Pfla/che) and maximally activated for σD activity by overexpression of sigD and mutation of flgMD-ON, DS5737) plotted relative to transcript abundance of a strain only mutated for PD-3 and Pfla/cheD-OFF, DS5504). RNA was purified from each strain and quantitative RT-PCR was performed using primer sets specific to the indicated genes in the fla/che operon normalized internally to the levels of sigA transcript.

References

    1. Albertini AM, Caramori T, Crabb W, Scoffone F, Galizzi A. The flaA locus of Bacillus subtilis is part of a large operon coding for flagellar structures, motility functions, and an ATPase-like polypeptide. J. Bacteriol. 1991;173:3573–3573. - PMC - PubMed
    1. Allmansberger R. Temporal regulation of sigD from Bacillus subtilis depends on a minor promoter in front of the gene. J Bacteriol. 1997;179:6531–6535. - PMC - PubMed
    1. Antoniewski C, Savelli B, Stragier P. The spoIIJ gene, which regulates early developmental steps in Bacillus subtilis, belongs to a class of environmentally responsive genes. J Bacteriol. 1990;172:86–93. - PMC - PubMed
    1. Barilla D, Caramori T, Galizzi A. Coupling of flagellin gene transcription to flagellar assembly in Bacillus subtilis. J Bacteriol. 1994;176:4558–4564. - PMC - PubMed
    1. Bigger JW. Treatment of staphylococcal infections with penicillin. Lancet. 1944;ii:497–500.

Publication types

LinkOut - more resources