

Current crisis or artifact of surveillance: insights into rebound chlamydia rates from dynamic modelling
- PMID: 20233416
- PMCID: PMC2848153
- DOI: 10.1186/1471-2334-10-70
Current crisis or artifact of surveillance: insights into rebound chlamydia rates from dynamic modelling
Abstract
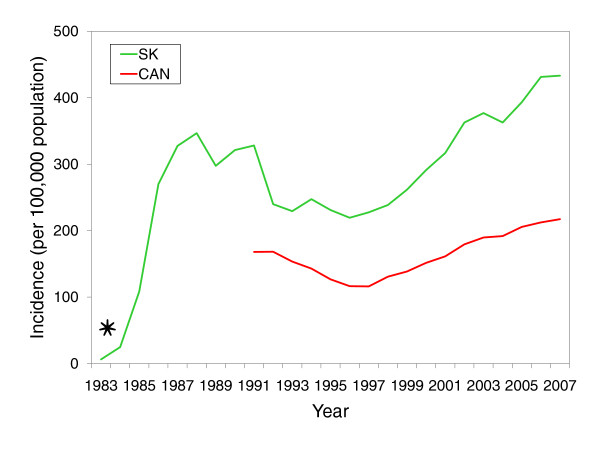
Background: After initially falling in the face of intensified control efforts, reported rates of sexually transmitted chlamydia in many developed countries are rising. Recent hypotheses for this phenomenon have broadly focused on improved case finding or an increase in the prevalence. Because of many complex interactions behind the spread of infectious diseases, dynamic models of infection transmission are an effective means to guide learning, and assess quantitative conjectures of epidemiological processes. The objective of this paper is to bring a unique and robust perspective to observed chlamydial patterns through analyzing surveillance data with mathematical models of infection transmission.
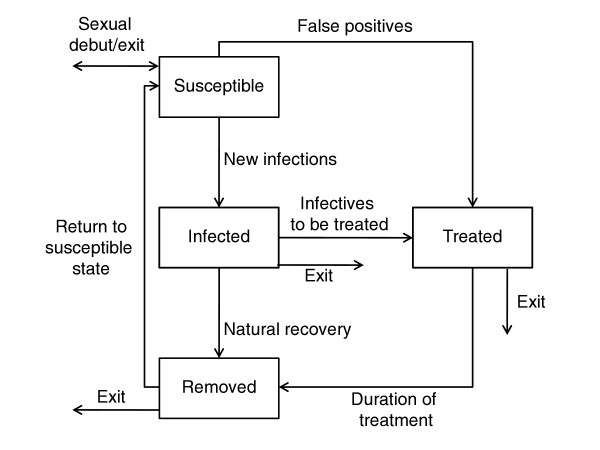
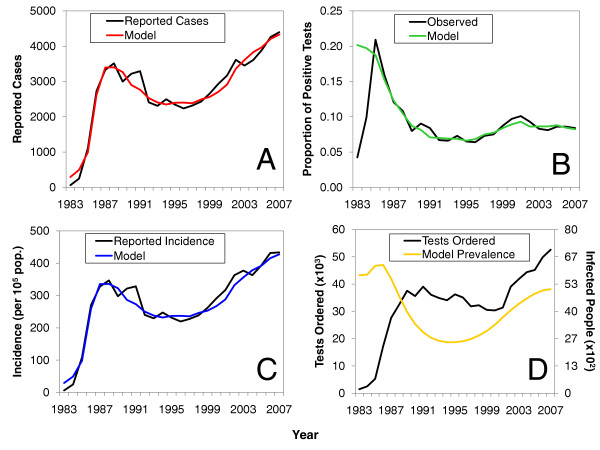
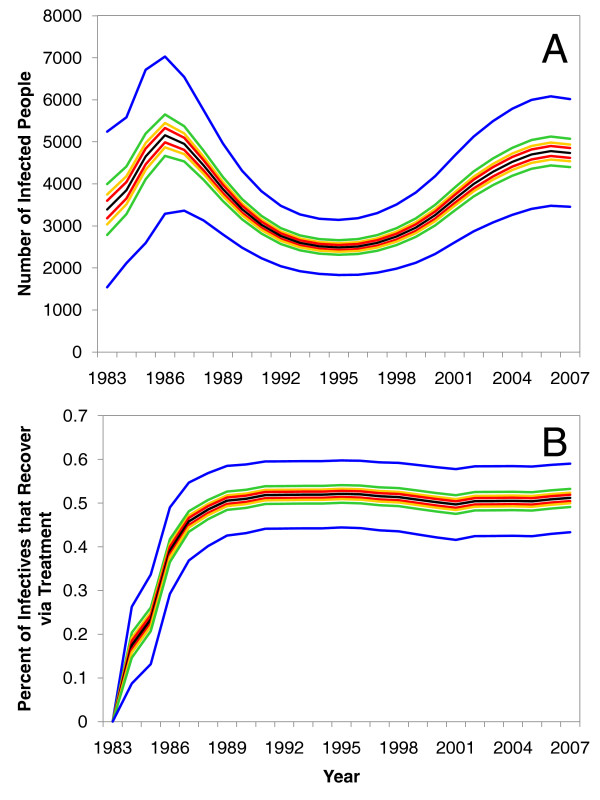
Methods: This study integrated 25-year testing volume data from the Canadian province of Saskatchewan with one susceptible-infected-treated-susceptible and three susceptible-infected-treated-removed compartmental models. Calibration of model parameters to fit observed 25-year case notification data, after being combined with testing records, placed constraints on model behaviour and allowed for an approximation of chlamydia prevalence to be estimated. Model predictions were compared to observed case notification trends, and extensive sensitivity analyses were performed to confirm the robustness of model results.
Results: Model predictions accurately mirrored historic chlamydial trends including an observed rebound in the mid 1990s. For all models examined, the results repeatedly highlighted that increased testing volumes, rather than changes in the sensitivity and specificity of testing technologies, sexual behaviour, or truncated immunological responses brought about by treatment can, explain the increase in observed chlamydia case notifications.
Conclusions: Our results highlight the significant impact testing volume can have on observed incidence rates, and that simple explanations for these observed increases appear to have been dismissed in favor of changes to the underlying prevalence. These simple methods not only demonstrate geographic portability, but the results reassure the public health effort towards monitoring and controlling chlamydia.
Figures
Similar articles
-
Insights into the timing of repeated testing after treatment for Chlamydia trachomatis: data and modelling study.Sex Transm Infect. 2013 Feb;89(1):57-62. doi: 10.1136/sextrans-2011-050468. Epub 2012 Jun 8. Sex Transm Infect. 2013. PMID: 22683893
-
Coverage is the key for effective screening of Chlamydia trachomatis in Australia.J Infect Dis. 2008 Aug 1;198(3):349-58. doi: 10.1086/589883. J Infect Dis. 2008. PMID: 18588484
-
Lymphogranuloma venereum: a hidden emerging problem, Barcelona, 2011.Euro Surveill. 2012 Jan 12;17(2):20057. Euro Surveill. 2012. PMID: 22264862
-
Issues in the management of sexually transmitted diseases in Papua New Guinea.P N G Med J. 1996 Sep;39(3):252-60. P N G Med J. 1996. PMID: 9795576 Review.
-
Lymphogranuloma venereum among men who have sex with men. An epidemiological and clinical review.Expert Rev Anti Infect Ther. 2014 Jun;12(6):697-704. doi: 10.1586/14787210.2014.901169. Epub 2014 Mar 21. Expert Rev Anti Infect Ther. 2014. PMID: 24655220 Review.
Cited by
-
Pelvic inflammatory disease: identifying research gaps--proceedings of a workshop sponsored by Department of Health and Human Services/National Institutes of Health/National Institute of Allergy and Infectious Diseases, November 3-4, 2011.Sex Transm Dis. 2013 Oct;40(10):761-7. doi: 10.1097/OLQ.0000000000000028. Sex Transm Dis. 2013. PMID: 24275724 Free PMC article.
-
Pertussis resurgence in Toronto, Canada: a population-based study including test-incidence feedback modeling.BMC Public Health. 2011 Sep 7;11:694. doi: 10.1186/1471-2458-11-694. BMC Public Health. 2011. PMID: 21899765 Free PMC article.
-
The Use of Mathematical Models of Chlamydia Transmission to Address Public Health Policy Questions: A Systematic Review.Sex Transm Dis. 2017 May;44(5):278-283. doi: 10.1097/OLQ.0000000000000598. Sex Transm Dis. 2017. PMID: 28407643 Free PMC article.
-
Real-Time Epidemiology and Acute Care Need Monitoring and Forecasting for COVID-19 via Bayesian Sequential Monte Carlo-Leveraged Transmission Models.Int J Environ Res Public Health. 2024 Feb 7;21(2):193. doi: 10.3390/ijerph21020193. Int J Environ Res Public Health. 2024. PMID: 38397684 Free PMC article.
-
The recall response induced by genital challenge with Chlamydia muridarum protects the oviduct from pathology but not from reinfection.Infect Immun. 2012 Jun;80(6):2194-203. doi: 10.1128/IAI.00169-12. Epub 2012 Mar 19. Infect Immun. 2012. PMID: 22431649 Free PMC article.
References
-
- Public Health Agency of Canada. Canadian guidelines on sexually transmitted infections. http://www.phac-aspc.gc.ca/std-mts/sti-its/guide-lignesdir-eng.php
Publication types
MeSH terms
Grants and funding
LinkOut - more resources
Full Text Sources
