

High-throughput and single-cell imaging of NF-kappaB oscillations using monoclonal cell lines
- PMID: 20233427
- PMCID: PMC2848210
- DOI: 10.1186/1471-2121-11-21
High-throughput and single-cell imaging of NF-kappaB oscillations using monoclonal cell lines
Abstract
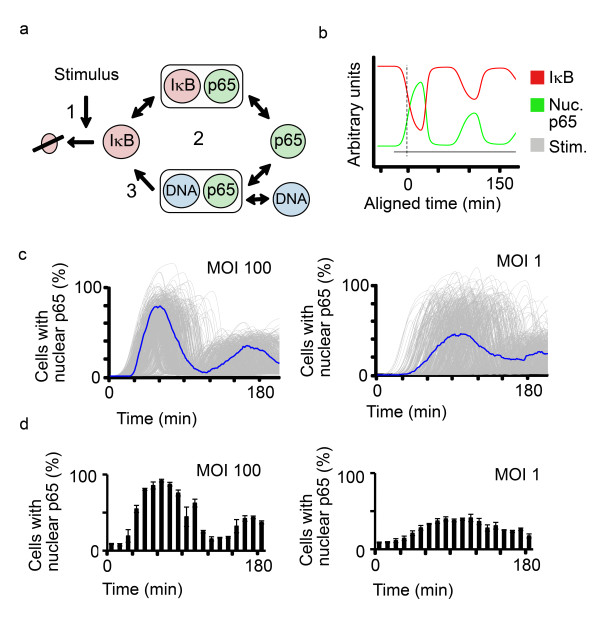
Background: The nuclear factor-kappaB (NF-kappaB) family of transcription factors plays a role in a wide range of cellular processes including the immune response and cellular growth. In addition, deregulation of the NF-kappaB system has been associated with a number of disease states, including cancer. Therefore, insight into the regulation of NF-kappaB activation has crucial medical relevance, holding promise for novel drug target discovery. Transcription of NF-kappaB-induced genes is regulated by differential dynamics of single NF-kappaB subunits, but only a few methods are currently being applied to study dynamics. In particular, while oscillations of NF-kappaB activation have been observed in response to the cytokine tumor necrosis factor alpha (TNFalpha), little is known about the occurrence of oscillations in response to bacterial infections.
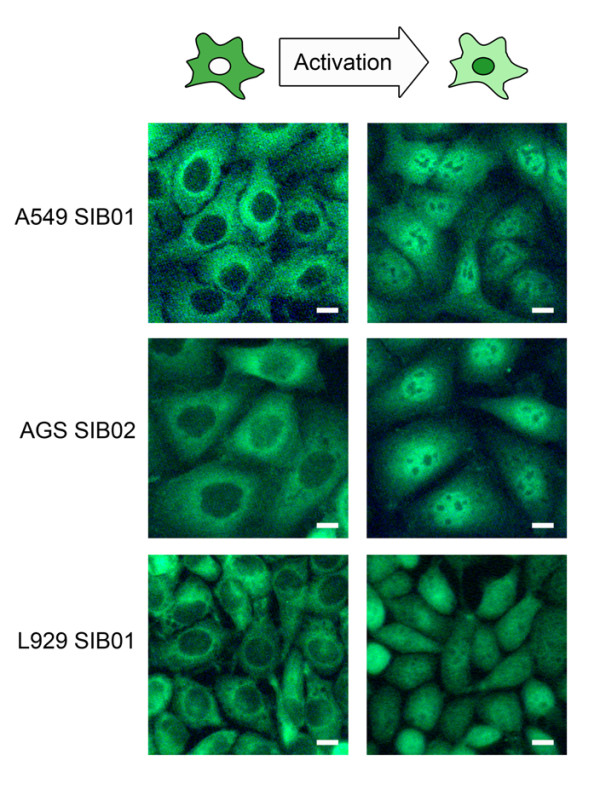
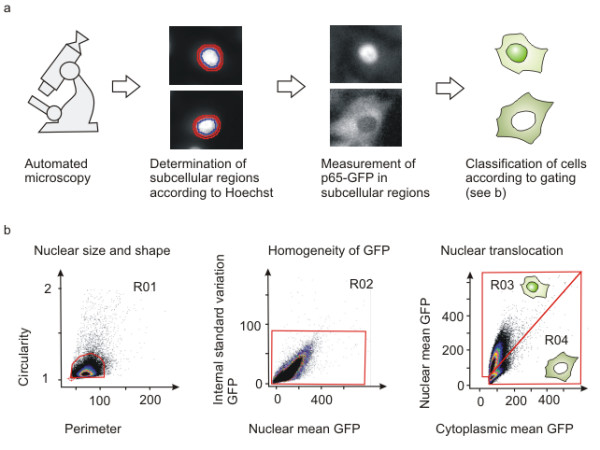
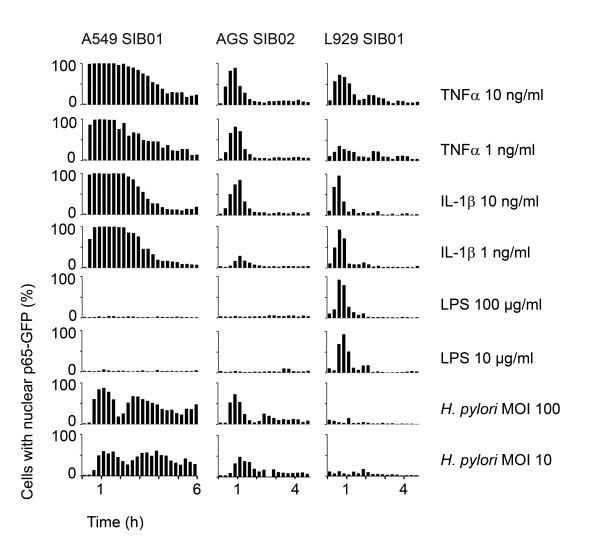
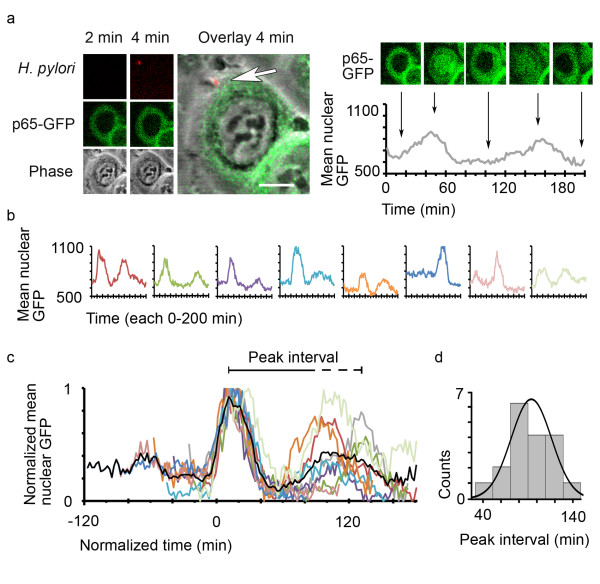
Results: To quantitatively assess NF-kappaB dynamics we generated human and murine monoclonal cell lines that stably express the NF-kappaB subunit p65 fused to GFP. Furthermore, a high-throughput assay based on automated microscopy coupled to image analysis to quantify p65-nuclear translocation was established. Using this assay, we demonstrate a stimulus- and cell line-specific temporal control of p65 translocation, revealing, for the first time, oscillations of p65 translocation in response to bacterial infection. Oscillations were detected at the single-cell level using real-time microscopy as well as at the population level using high-throughput image analysis. In addition, mathematical modeling of NF-kappaB dynamics during bacterial infections predicted masking of oscillations on the population level in asynchronous activations, which was experimentally confirmed.
Conclusions: Taken together, this simple and cost effective assay constitutes an integrated approach to infer the dynamics of NF-kappaB kinetics in single cells and cell populations. Using a single system, novel factors modulating NF-kappaB can be identified and analyzed, providing new possibilities for a wide range of applications from therapeutic discovery and understanding of disease to host-pathogen interactions.
Figures
Similar articles
-
GFP-p65 knock-in mice as a tool to study NF-kappaB dynamics in vivo.Genesis. 2009 May;47(5):323-9. doi: 10.1002/dvg.20468. Genesis. 2009. PMID: 19263497
-
Nuclear translocation kinetics of NF-kappaB in macrophages challenged with pathogens in a microfluidic platform.Biomed Microdevices. 2009 Jun;11(3):693-700. doi: 10.1007/s10544-008-9281-5. Biomed Microdevices. 2009. PMID: 19169824
-
p65 controls NF-κB activity by regulating cellular localization of IκBβ.Biochem J. 2011 Mar 1;434(2):253-63. doi: 10.1042/BJ20101220. Biochem J. 2011. PMID: 21158742
-
Moving to the core: spatiotemporal analysis of Forkhead box O (FOXO) and nuclear factor-κB (NF-κB) nuclear translocation.Traffic. 2013 Mar;14(3):247-58. doi: 10.1111/tra.12034. Epub 2013 Jan 2. Traffic. 2013. PMID: 23231504 Review.
-
Signal Distortion: How Intracellular Pathogens Alter Host Cell Fate by Modulating NF-κB Dynamics.Front Immunol. 2018 Dec 14;9:2962. doi: 10.3389/fimmu.2018.02962. eCollection 2018. Front Immunol. 2018. PMID: 30619320 Free PMC article. Review.
Cited by
-
Induction of microRNA-155 is TLR- and type IV secretion system-dependent in macrophages and inhibits DNA-damage induced apoptosis.Proc Natl Acad Sci U S A. 2012 May 8;109(19):E1153-62. doi: 10.1073/pnas.1116125109. Epub 2012 Apr 16. Proc Natl Acad Sci U S A. 2012. PMID: 22509021 Free PMC article.
-
Physiological levels of TNFalpha stimulation induce stochastic dynamics of NF-kappaB responses in single living cells.J Cell Sci. 2010 Aug 15;123(Pt 16):2834-43. doi: 10.1242/jcs.069641. Epub 2010 Jul 27. J Cell Sci. 2010. PMID: 20663918 Free PMC article.
-
3D Organoids: An Untapped Platform for Studying Host-Microbiome Interactions in Esophageal Cancers.Microorganisms. 2021 Oct 20;9(11):2182. doi: 10.3390/microorganisms9112182. Microorganisms. 2021. PMID: 34835308 Free PMC article. Review.
-
Bioluminescence Imaging to Monitor the Effects of the Hsp90 Inhibitor NVP-AUY922 on NF-κB Pathway in Endometrial Cancer.Mol Imaging Biol. 2016 Aug;18(4):545-56. doi: 10.1007/s11307-015-0907-8. Mol Imaging Biol. 2016. PMID: 26604096
-
Drug-induced cell cycle modulation leading to cell-cycle arrest, nuclear mis-segregation, or endoreplication.BMC Cell Biol. 2011 Jan 13;12:2. doi: 10.1186/1471-2121-12-2. BMC Cell Biol. 2011. PMID: 21226962 Free PMC article.
References
Publication types
MeSH terms
Substances
LinkOut - more resources
Full Text Sources
