

Analysis of DNA strand-specific differential expression with high density tiling microarrays
- PMID: 20233458
- PMCID: PMC2858035
- DOI: 10.1186/1471-2105-11-136
Analysis of DNA strand-specific differential expression with high density tiling microarrays
Abstract
Background: DNA microarray technology allows the analysis of genome structure and dynamics at genome-wide scale. Expression microarrays (EMA) contain probes for annotated open reading frames (ORF) and are widely used for the analysis of differential gene expression. By contrast, tiling microarrays (TMA) have a much higher probe density and provide unbiased genome-wide coverage. The purpose of this study was to develop a protocol to exploit the high resolution of TMAs for quantitative measurement of DNA strand-specific differential expression of annotated and non-annotated transcripts.
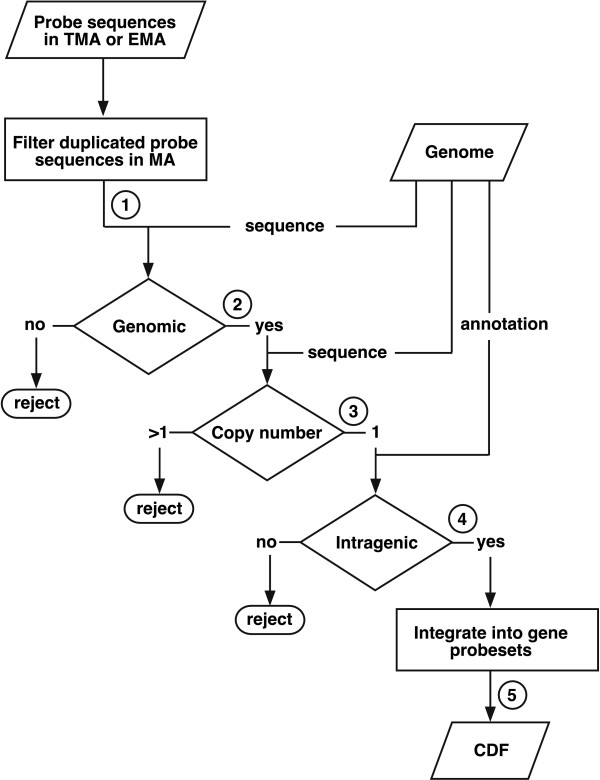
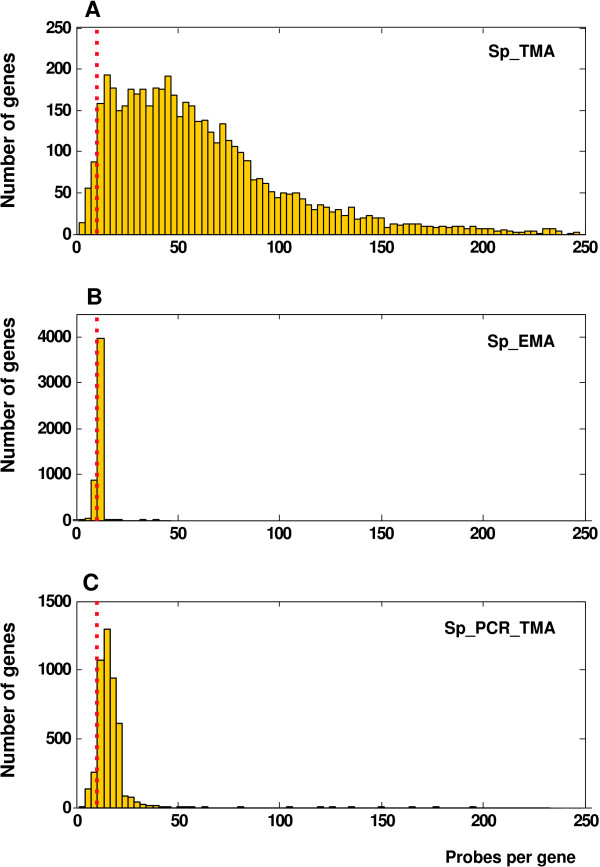
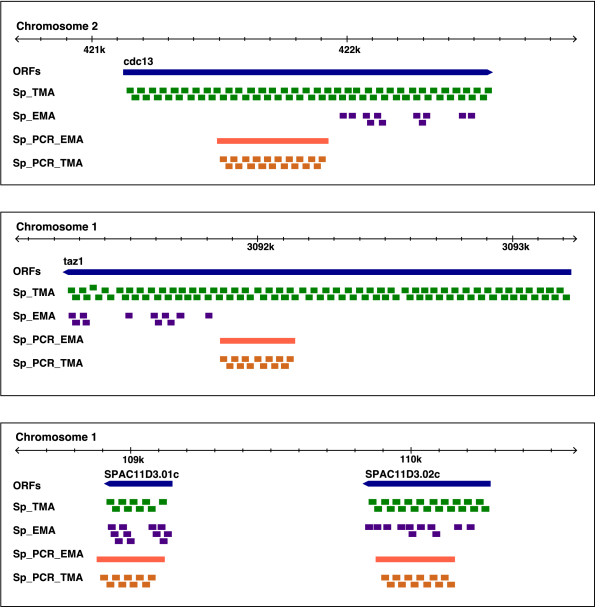
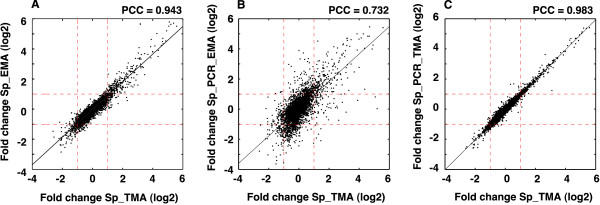
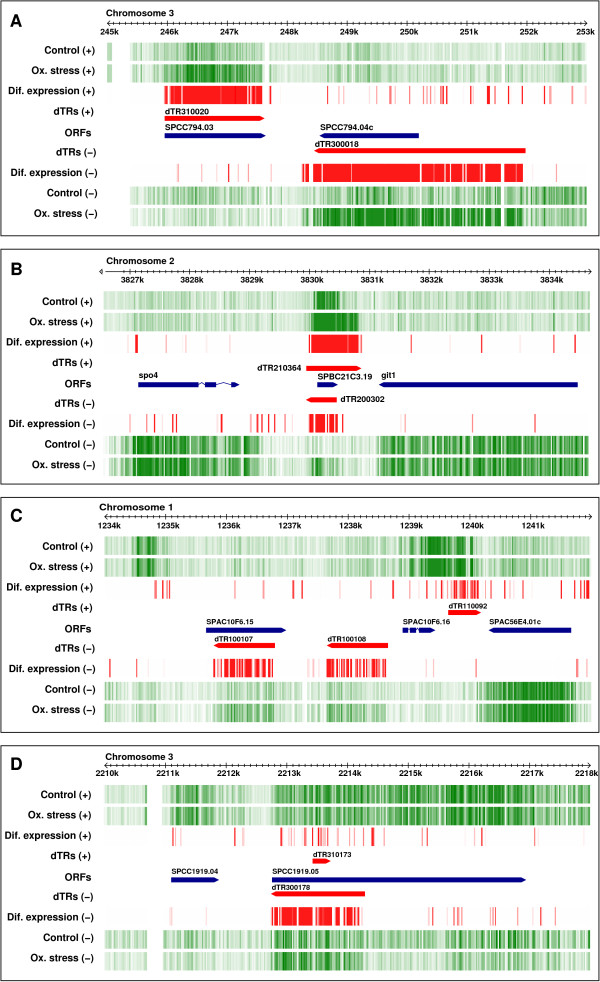
Results: We extensively filtered probes present in Affymetrix Genechip Yeast Genome 2.0 expression and GeneChip S. pombe 1.0FR tiling microarrays to generate custom Chip Description Files (CDF) in order to compare their efficiency. We experimentally tested the potential of our approach by measuring the differential expression of 4904 genes in the yeast Schizosaccharomyces pombe growing under conditions of oxidative stress. The results showed a Pearson correlation coefficient of 0.943 between both platforms, indicating that TMAs are as reliable as EMAs for quantitative expression analysis. A significant advantage of TMAs over EMAs is the possibility of detecting non-annotated transcripts generated only under specific physiological conditions. To take full advantage of this property, we have used a target-labelling protocol that preserves the original polarity of the transcripts and, therefore, allows the strand-specific differential expression of non-annotated transcripts to be determined. By using a segmentation algorithm prior to generating the corresponding custom CDFs, we identified and quantitatively measured the expression of 510 transcripts longer than 180 nucleotides and not overlapping previously annotated ORFs that were differentially expressed at least 2-fold under oxidative stress.
Conclusions: We show that the information derived from TMA hybridization can be processed simultaneously for high-resolution qualitative and quantitative analysis of the differential expression of well-characterized genes and of previously non-annotated and antisense transcripts. The consistency of the performance of TMA, their genome-wide coverage and adaptability to updated genome annotations, and the possibility of measuring strand-specific differential expression makes them a tool of choice for the analysis of gene expression in any organism for which TMA platforms are available.
Figures
Similar articles
-
Genome-wide transcriptome analysis in yeast using high-density tiling arrays.Methods Mol Biol. 2011;759:107-23. doi: 10.1007/978-1-61779-173-4_7. Methods Mol Biol. 2011. PMID: 21863484
-
Gene expression and isoform variation analysis using Affymetrix Exon Arrays.BMC Genomics. 2008 Nov 7;9:529. doi: 10.1186/1471-2164-9-529. BMC Genomics. 2008. PMID: 18990248 Free PMC article.
-
An alternative method to amplify RNA without loss of signal conservation for expression analysis with a proteinase DNA microarray in the ArrayTube format.BMC Genomics. 2006 Jun 12;7:144. doi: 10.1186/1471-2164-7-144. BMC Genomics. 2006. PMID: 16768788 Free PMC article.
-
Applications of DNA tiling arrays for whole-genome analysis.Genomics. 2005 Jan;85(1):1-15. doi: 10.1016/j.ygeno.2004.10.005. Genomics. 2005. PMID: 15607417 Review.
-
[Transcriptomes for serial analysis of gene expression].J Soc Biol. 2002;196(4):303-7. J Soc Biol. 2002. PMID: 12645300 Review. French.
Cited by
-
Non-Coding RNAs: Regulators of Stress, Ageing, and Developmental Decisions in Yeast?Cells. 2024 Mar 29;13(7):599. doi: 10.3390/cells13070599. Cells. 2024. PMID: 38607038 Free PMC article. Review.
-
Clustered regulatory elements at nucleosome-depleted regions punctuate a constant nucleosomal landscape in Schizosaccharomyces pombe.BMC Genomics. 2013 Nov 21;14(1):813. doi: 10.1186/1471-2164-14-813. BMC Genomics. 2013. PMID: 24256300 Free PMC article.
-
New insights into the RNA-based mechanism of action of the anticancer drug 5'-fluorouracil in eukaryotic cells.PLoS One. 2013 Nov 1;8(11):e78172. doi: 10.1371/journal.pone.0078172. eCollection 2013. PLoS One. 2013. PMID: 24223771 Free PMC article.
-
Contrasting expression patterns of coding and noncoding parts of the human genome upon oxidative stress.Sci Rep. 2015 May 29;5:9737. doi: 10.1038/srep09737. Sci Rep. 2015. PMID: 26024509 Free PMC article.
-
Gcn5 facilitates Pol II progression, rather than recruitment to nucleosome-depleted stress promoters, in Schizosaccharomyces pombe.Nucleic Acids Res. 2011 Aug;39(15):6369-79. doi: 10.1093/nar/gkr255. Epub 2011 Apr 22. Nucleic Acids Res. 2011. PMID: 21515633 Free PMC article.
References
Publication types
MeSH terms
Substances
LinkOut - more resources
Full Text Sources
Molecular Biology Databases
Research Materials
