. 2010 Jul;47(1):12-22.
doi: 10.1016/j.bone.2010.03.006. Epub 2010 Mar 15.

A promising approach for treatment of tumor-induced bone diseases: utilizing bisphosphonate derivatives of nucleoside antimetabolites

Affiliations

A promising approach for treatment of tumor-induced bone diseases: utilizing bisphosphonate derivatives of nucleoside antimetabolites

Monica M Reinholz et al. Bone. 2010 Jul.

Abstract

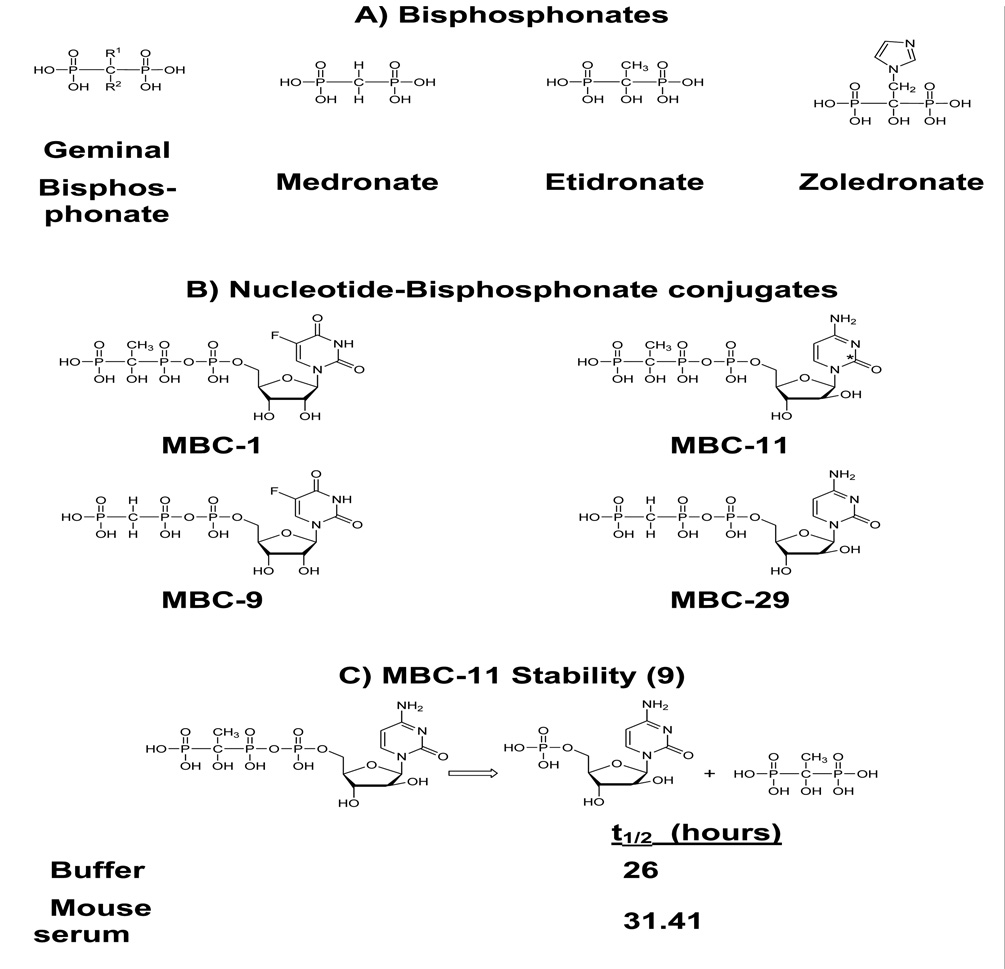
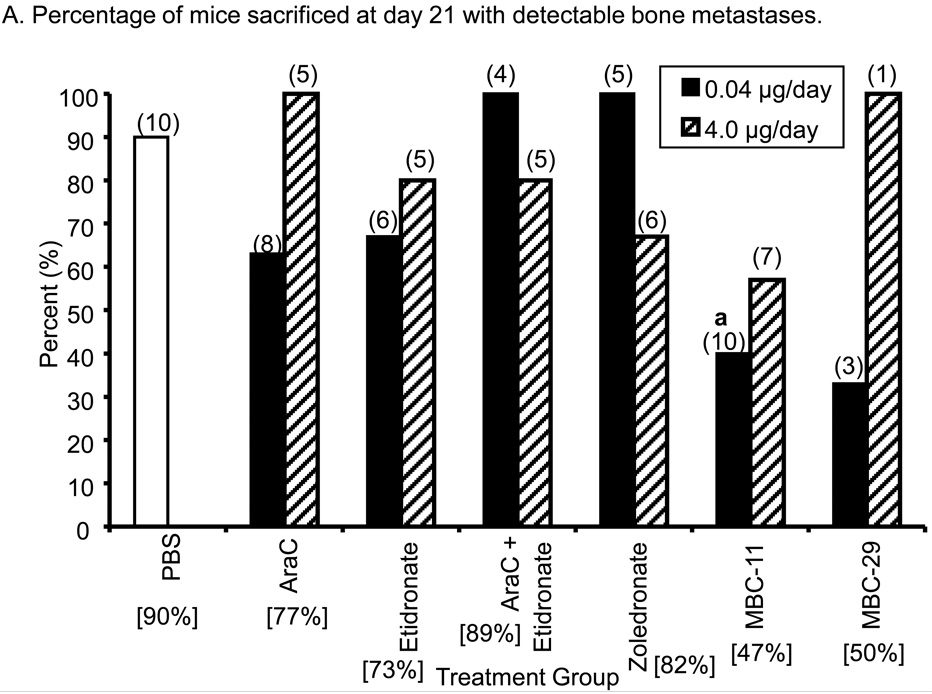
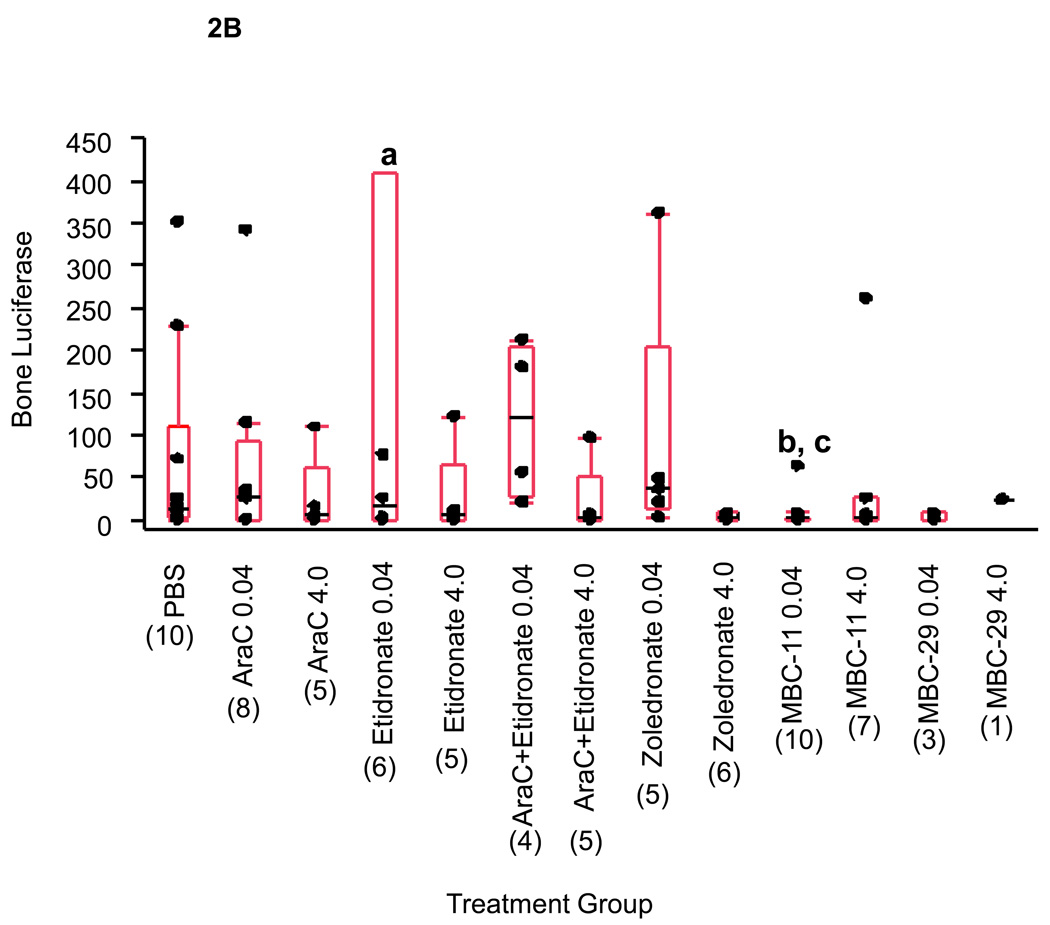
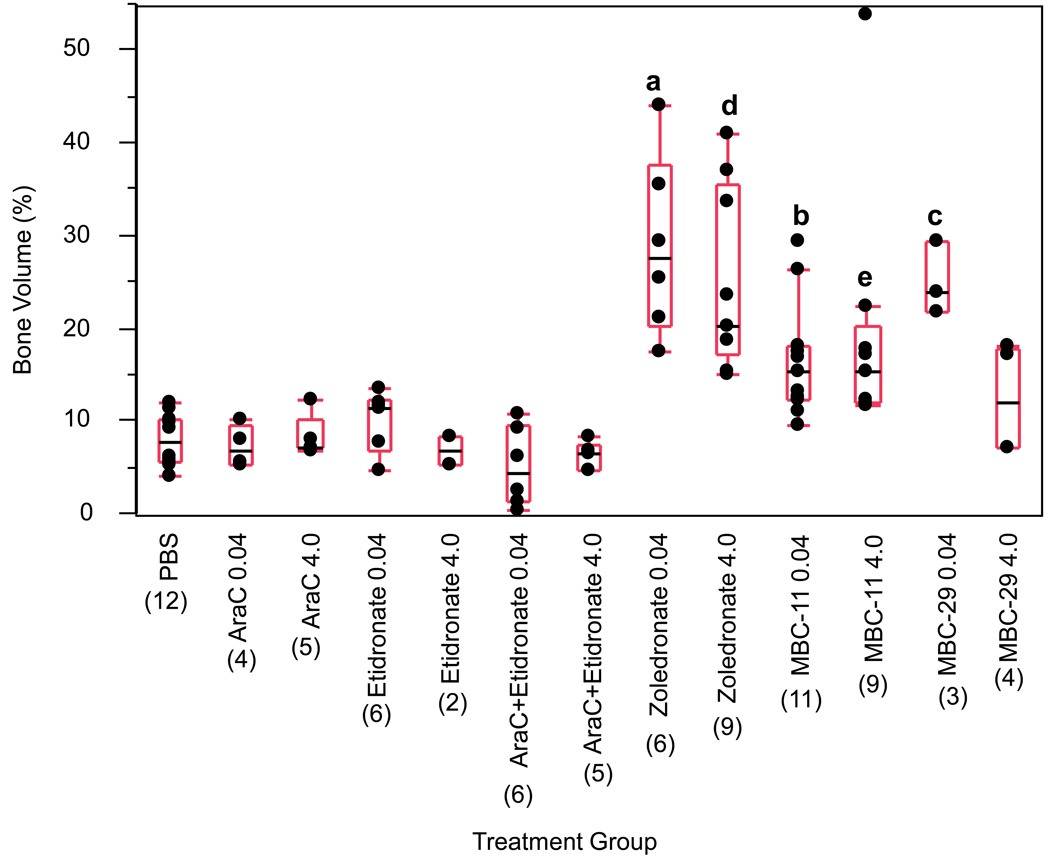
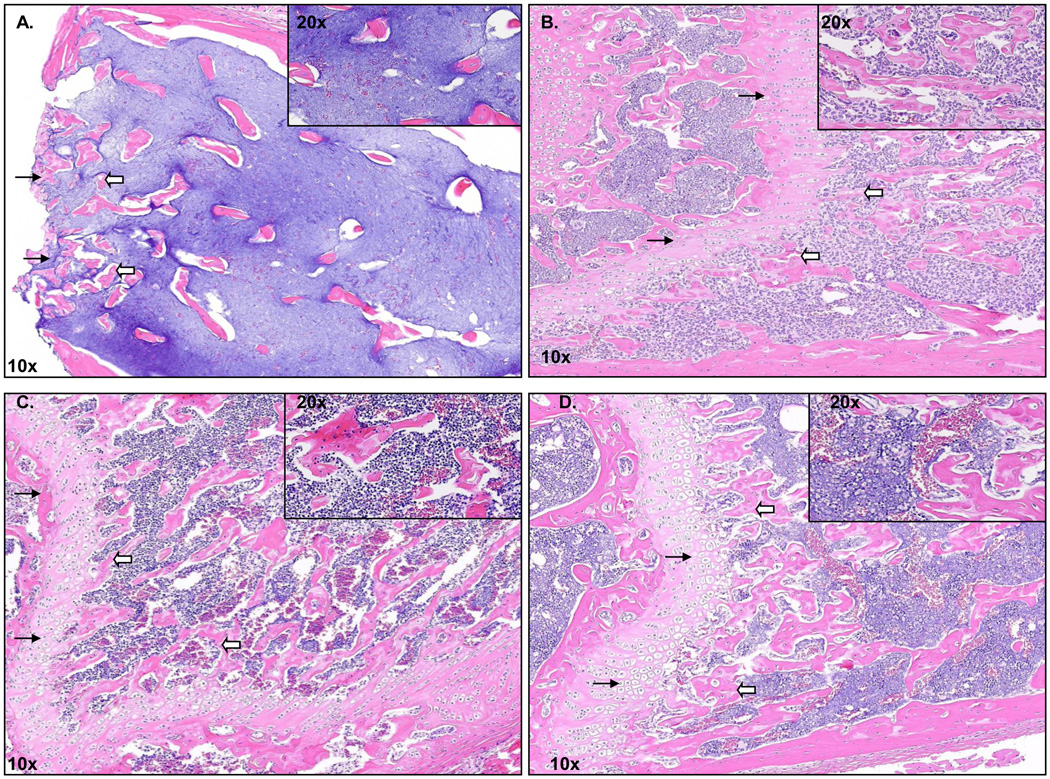
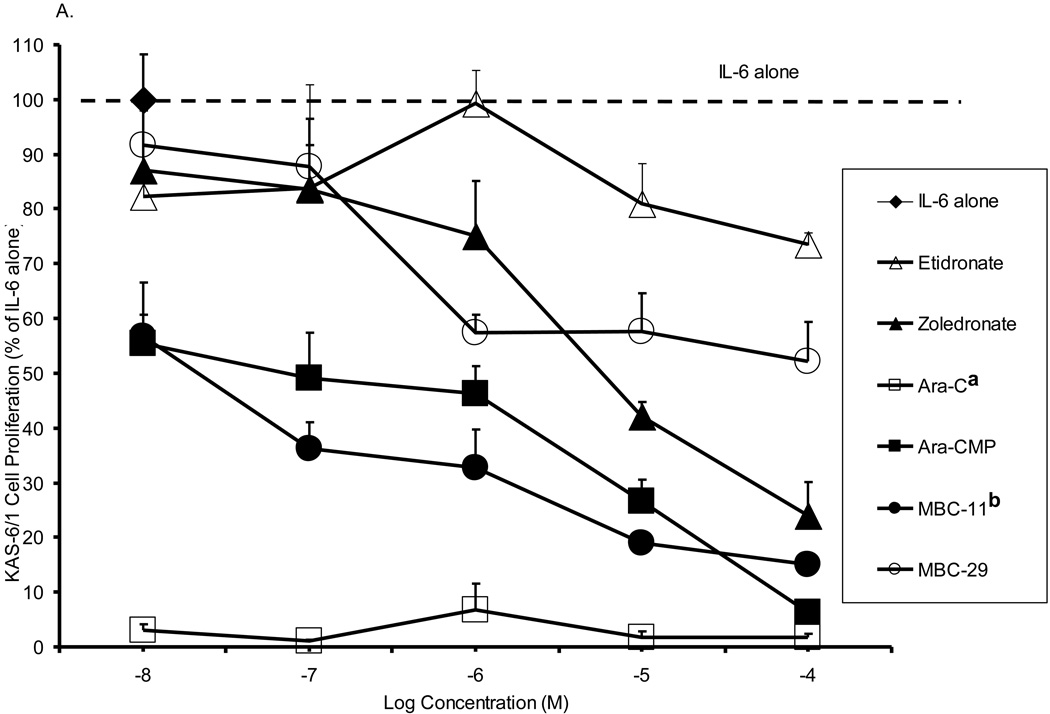
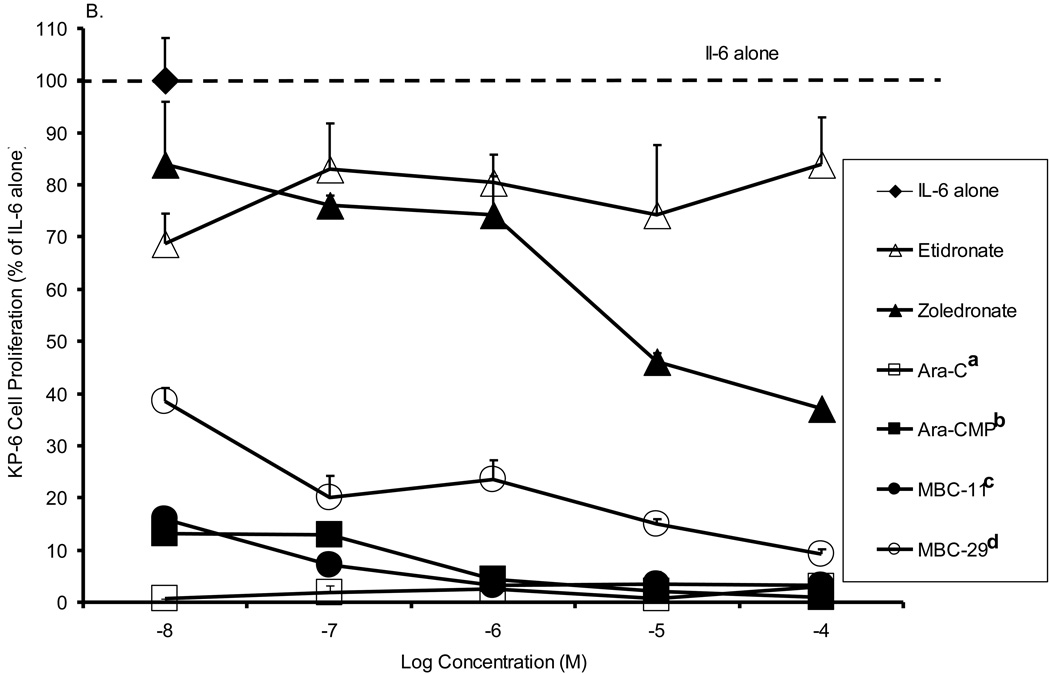
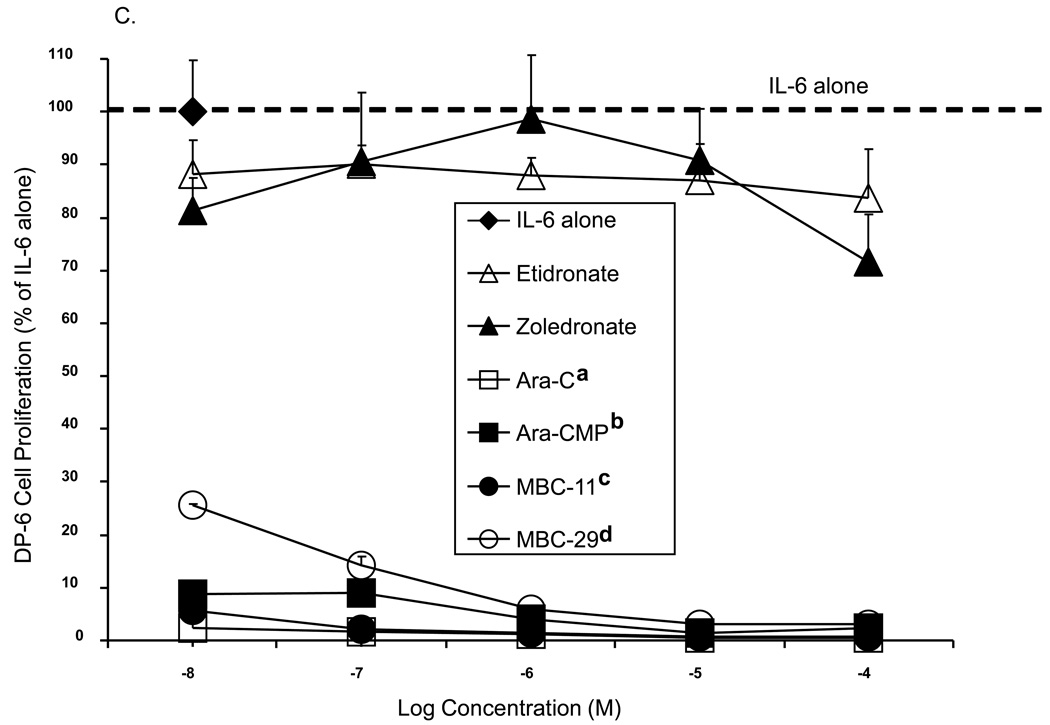
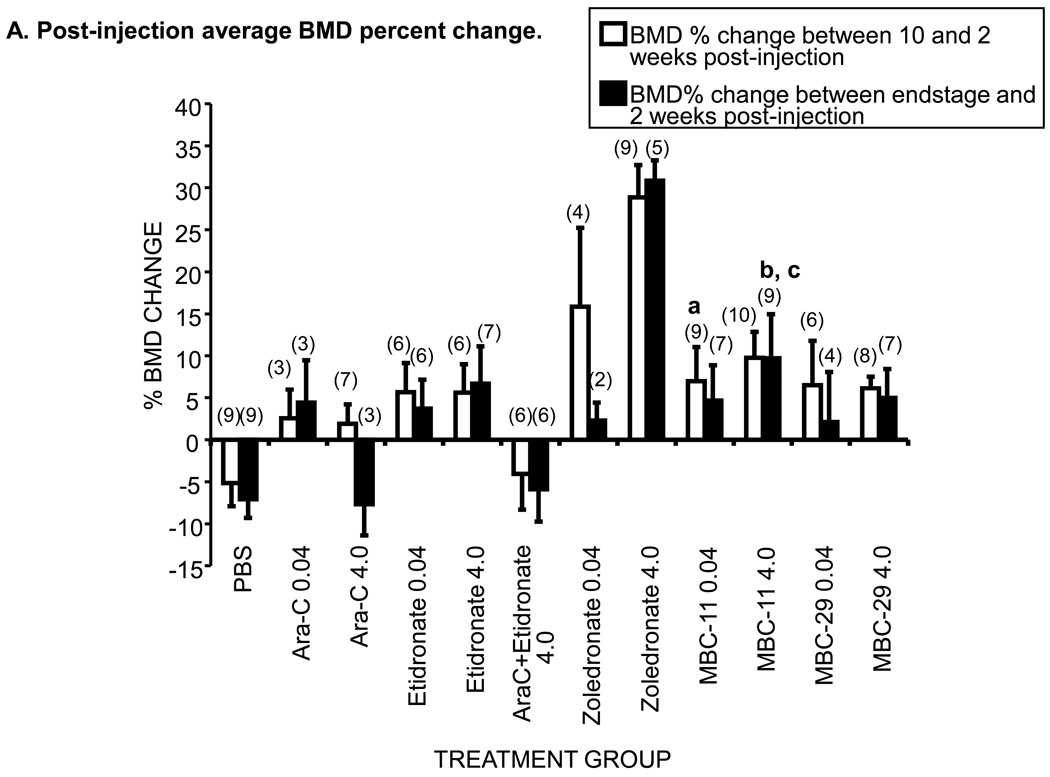
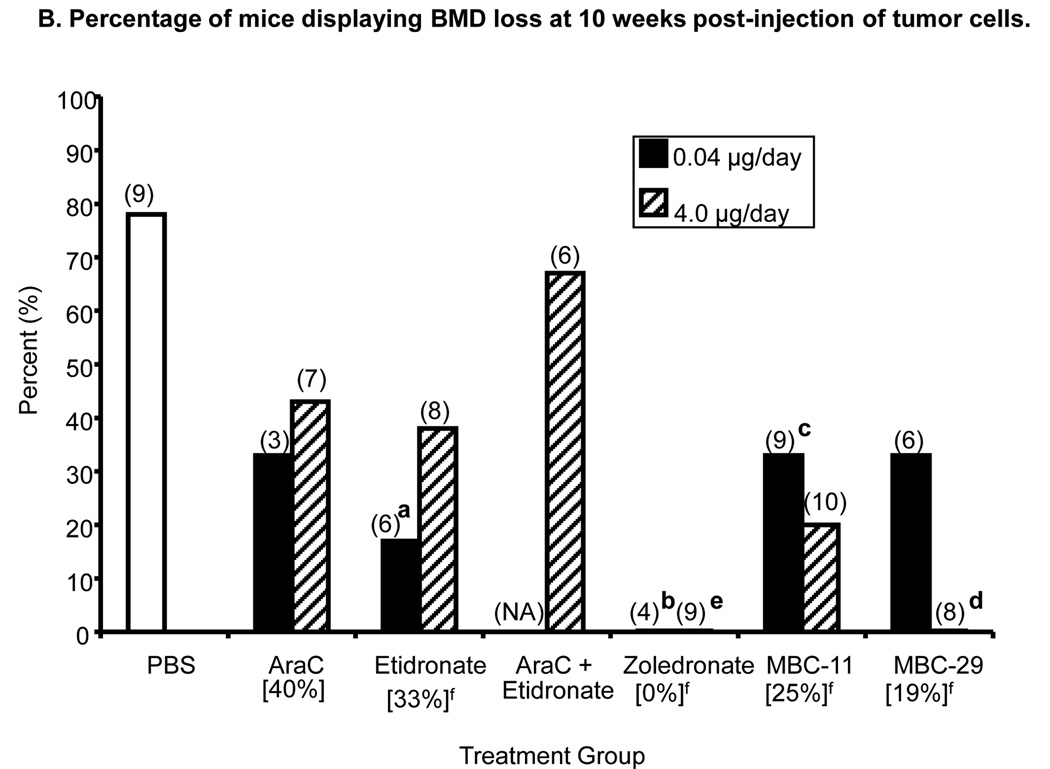
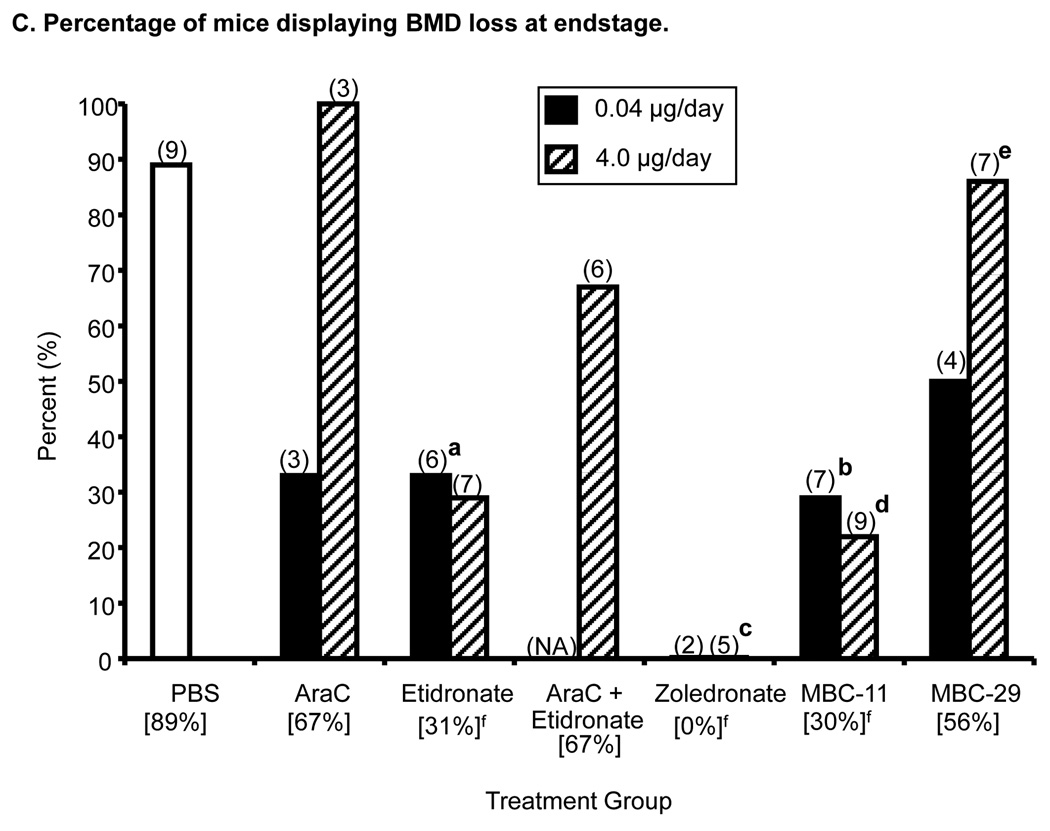
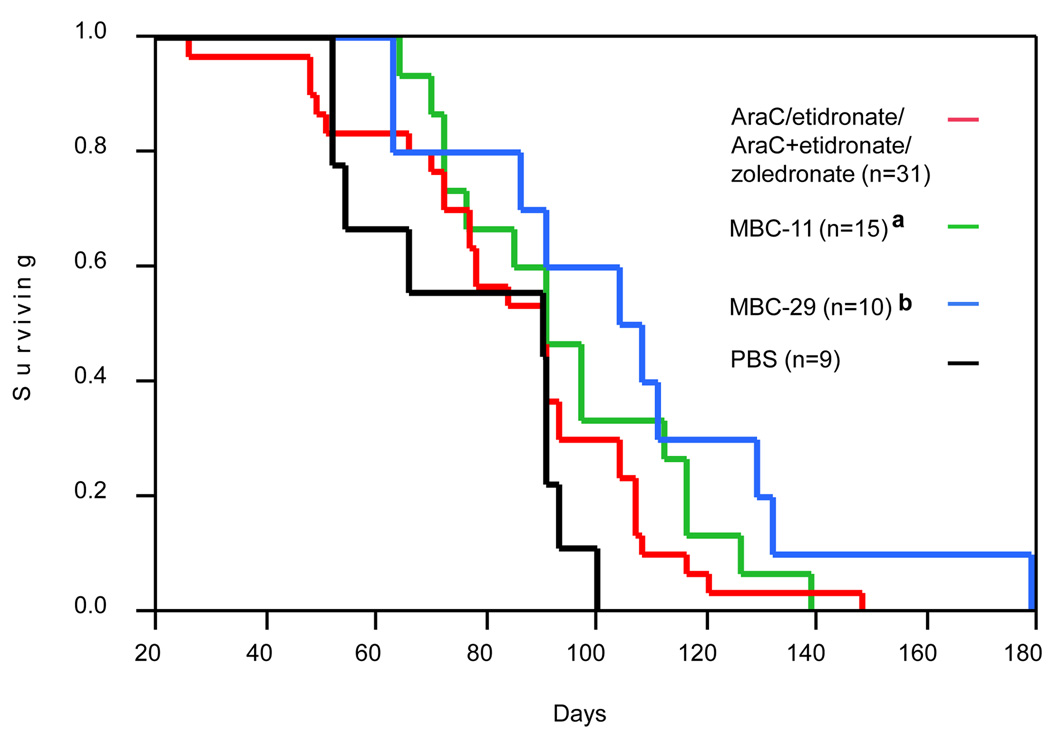
Despite palliative treatments, tumor-induced bone disease (TIBD) remains highly debilitating for many cancer patients and progression typically results in death within two years. Therefore, more effective therapies with enhanced anti-resorptive and cytotoxic characteristics are needed. We developed bisphosphonate-chemotherapeutic conjugates designed to bind bone and hydrolyze, releasing both compounds, thereby targeting both osteoclasts and tumor cells. This study examined the effects of our lead compound, MBC-11 (the anhydride formed between arabinocytidine (AraC)-5'-phosphate and etidronate), on bone tumor burden, bone volume, femur bone mineral density (BMD), and overall survival using two distinct mouse models of TIBD, the 4T1/luc breast cancer and the KAS-6/1-MIP1alpha multiple myeloma models. In mice orthotopically inoculated with 4T1/luc mouse mammary cells, MBC-11 (0.04 microg/day; s.c.) reduced the incidence of bone metastases to 40% (4/10), compared to 90% (9/10; p=0.057) and 100% (5/5; p=0.04) of PBS- or similarly-dosed, zoledronate-treated mice, respectively. MBC-11 also significantly decreased bone tumor burden compared to PBS- or zoledronate-treated mice (p=0.021, p=0.017, respectively). MBC-11 and zoledronate (0.04 microg/day) significantly increased bone volume by two- and four-fold, respectively, compared to PBS-treated mice (p=0.005, p<0.001, respectively). In mice systemically injected with human multiple myeloma KAS-6/1-MIP1alpha cells, 0.04 and 4.0 microg/day MBC-11 improved femur BMD by 13% and 16%, respectively, compared to PBS (p=0.025, p=0.017, respectively) at 10 weeks post-tumor cell injection and increased mean survival to 95 days compared to 77 days in mice treated with PBS (p=0.047). Similar doses of zoledronate also improved femur BMD (p< or =0.01 vs PBS) and increased mean survival to 86 days, but this was not significantly different than in PBS-treated mice (p=0.53). These results demonstrate that MBC-11 decreases bone tumor burden, maintains bone structure, and may increase overall survival, warranting further investigation as a treatment for TIBD.


Conflict of interest statement

Conflicts of Interest: Dr. Monica Reinholz received research funding for supplies and animals from MBC Pharma to supplement a portion of the in vivo efficacy studies that was not supported by the NIH grants. Dr. Reinholz, her spouse, or any of her dependents have no personal financial interest (such as company stocks or shares or equity) in MBC Pharma. Drs. Zinnen, Sebesta, and Karpeisky were employees of MBC Pharma at the time the work was performed. All other co-authors have no personal financial interest in MBC Pharma or conflicts of interest.

Figures

Figure 1
Figure 1. Chemical structures of bisphosphonates and associated conjugates and stability of MBC-11
A. Chemical structures of bisphosphonates. B. Chemical structures of nucleotide-bisphosphonate conjugates, shown as free acids. * Indicates position of [14-C] label C. Chemical hydrolysis and ex vivo stability of MBC-11 in mouse and human sera [9].
Figure 2
Figure 2. The effects of MBC-11, MBC-29, and control treatments on bone tumor burden in 4T1/luc-inoculated mice
A. Percentage of mice sacrificed at day 21 with detectable bone luciferase activity. Detectable bone luciferase activity was defined as > 1 unit of luciferase activity (U)/mg total bone tissue protein. Parenthetic values indicate group size. Bracketed values indicate the overall percentage of mice displaying detectable bone luciferase activity from each treatment group. Likelihood Ratio χ2 analysis of PBS and 0.04 µg/day dose groups: p=0.024; two-tail Fisher's Exact test: a: MBC-11 vs. PBS p=0.057; MBC-11 vs. zoledronate p=0.044. B. Luciferase activity in bone tissue from mice sacrificed at day 21. Luciferase activity was normalized to total bone tissue protein (U/mg protein). Box plot values represent the 25%, median, and 75% quartiles luciferase activity, and parenthetic values indicate group size. a: For graphing purposes, a luciferase activity value of 1410 U/mg for the etidronate 0.04 µg/day treatment group was not shown. b: Kruskal-Wallis ANOVA on Ranks analysis of PBS and 0.04 µg/day dose groups: p=0.042. c: Wilcoxon Rank Sum analyses: p=0.021, p=0.013, and p=0.017 for MBC-11 vs PBS, AraC+etidronate, and zoledronate, respectively. The median luciferase activity in bone tissue of mice sacrificed at day 21 for MBC-1 and -9, FU, and FUR is presented in Supplemental Figure S2.
Figure 3
Figure 3. The effects of MBC-11, MBC-29, and control treatments on bone volume of femurs from 4T1/luc-inoculated mice sacrified at endstage (day 28)
Box plot values represent the 25%, median, and 75% quartiles of percent bone volume and parenthetic values indicate group size. ANOVA analyses for each dose group: p<0.001. ANOVA/Tukey analyses of PBS and 0.04µg/day dose groups: a : p<0.001 for zoledronate vs each treatment except MBC-29 (p=0.947); b: p=0.005, p=0.058, p=0.22, and p=0.002 for MBC-11 vs PBS, AraC, etidronate, and AraC+etidronate, respectively; c: p<0.001, p=0.001, p=0.004, p<0.001, and p=0.20 for MBC-29 vs PBS, AraC, etidronate, AraC+etidronate, and MBC-11, respectively. Kruskal-Wallis ANOVA/Dunn’s analyses of PBS and 4.0 µg/day dose groups: d : p<0.05 for zoledronate vs AraC+etidronate; e: p<0.05 for MBC-11 vs AraC+etidronate. The median bone volume in mice treated with MBC-1 and -9, FU, and FUR and sacrificed at endstage is shown in Supplemental Table S6.
Figure 4
Figure 4. Bone histology of distal femur from Balb/c mice
A. Representative femur bone histology from PBS-treated endstage 4T1/luc mice. B. Representative femur bone histology from 0.04 µg/day zoledronate-treated endstage 4T1/luc mice. C. Representative femur bone histology from 0.04 µg/day MBC-11-treated endstage 4t1/luc mice. D. Representative femur bone histology of a non-tumor cell injected mouse. Black arrows represent the growth plate and white arrow blocks represent the trabeculae. Magnification for all pictures is 10× (inset is 20×).
Figure 5
Figure 5. The effects of MBC-11, MBC-29, and control treatments on multiple myeloma cell proliferation in vitro
A. KAS-6/1 cell proliferation. Two-way ANOVA analyses: compound effect p<0.001; dose effect p=0.328. a: Tukey p<0.001 AraC vs etidronate, zoledronate, and MBC-29, p=0.053 AraC vs Ara-CMP. b: Tukey p=0.03 MBC-11 vs MBC-29. B. KP-6 cell proliferation. Two-way ANOVA analyses: compound effect p<0.001; dose effect p=0.068. a: Tukey p<0.001 AraC vs etidronate and zoledronate; b: Tukey p<0.001 Ara-CMP vs etidronate and zoledronate, p=0.041 Ara-CMP vs MBC-29; c: Tukey p<0.001 MBC-11 vs etidronate and zoledronate; d: Tukey p<0.001 MBC-29 vs etidronate and zoledronate. C. DP-6 cell proliferation. Two-way ANOVA analyses: compound effect p<0.001; dose effect p=0.098. a: Tukey p<0.001 AraC vs etidronate and zoledronate; b: Tukey p<0.001 Ara-CMP vs etidronate and zoledronate; c: Tukey p<0.001 MBC-11 vs etidronate and zoledronate; d: Tukey p<0.001 MBC-29 vs etidronate and zoledronate. Data are presented as percent of cell proliferation by IL-6 alone (positive control) and values represent the mean of duplicate or triplicate analyses ± the standard deviation in the presence of IL-6. Cell proliferation was also measured in the absence of IL-6, and these values were similar to background levels (data not shown).
Figure 6
Figure 6. The effects of MBC-11, MBC-29, and control treaments on femur bone mineral density (BMD) of KAS-6/1-MIP1α-injected mice
A. Post-injection average percent BMD changes between two and 10 weeks and two weeks and endstage in affected mice. Error bars represent standard error of the mean. Parenthetic values indicate group size. Week 10 analysis included mice that were sacrificed by or still alive at 10 weeks post-tumor cell injection. Endstage analysis included animals that were sacrificed or censored (overdosed, OD) and not the mice that were alive at study end. The average percent BMD loss between two weeks post-tumor cell injection and pre-injection typically ranged between 5–7% for all treatment groups except average initial losses of < 3.5% were observed for 0.04µg/day AraC, 0.04µg/day etidronate, and 0.04 and 4.0 µg/day zoledronate treatment groups (Supplemental Table S7). a: Week10 ANOVA of PBS and 0.04µg/day dose groups: p=0.078. t-tests: p=0.025 MBC-11 vs PBS; p=0.052 MBC-29 vs PBS; p=0.015 zoledronate vs PBS. b: Week 10 ANOVA of PBS and 4.0µg/day dose groups: p<0.001; ANOVA/Tukey: p=0.011 MBC-11 vs PBS; p<0.001 zoledronate vs PBS. c:Endstage ANOVA of PBS and 4.0µg/day dose groups: p<0.001; ANOVA/Tukey, p= 0.027 MBC-11 vs PBS; p<0.001 zoledronate vs PBS. B. Percentage of mice displaying BMD loss at 10 weeks post-tumor cell injection. Parenthetic values indicate group size. Bracketed values represent the overall percentage of mice displaying BMD loss from each treatment group (when dose groups are pooled). Likelihood Ratio χ2 analyses of PBS and 0.04 µg/day dose groups, p=0.011; two-tailed Fisher’s Exact tests: a: etidronate vs PBS, p=0.041; b: zoledronate vs PBS, p=0.021. Likelihood Ratio χ2 analyses of PBS and 4.0 µg/day dose groups, p=0.0003; two-tailed Fisher’s Exact tests: c: MBC-11 vs PBS, p=0.023; d: MBC-29 vs PBS, p=0.002; e: zoledronate vs PBS, p=0.002. Secondary analyses included f: Likelihood Ratio χ2 analyses across PBS and the two dose levels pooled for each compound: p=0.0007; Two-tailed Fisher’s Exact tests: PBS versus etidronate, zoledronate, MBC-11, and MBC-29: p=0.036, 0.0002, 0.023, and 0.007, respectively. NA: not applicable. C. The percentage of mice displaying BMD loss at endstage. Parenthetic values indicate group size. Bracketed values represent the overall percentage of mice displaying BMD loss from each treatment group (when dose groups are pooled). Likelihood Ratio χ2 analyses of PBS and 0.04 µg/day dose groups, p=0.046; Two-tailed Fisher’s Exact tests: a: etidronate vs PBS, p=0.08; b: MBC-11 vs PBS, p=0.035; Likelihood Ratio χ2 analyses of PBS and 4.0 µg/day dose groups, p=0.001; Two-tailed Fisher’s Exact tests: c: zoledronate vs PBS, p=0.02 d: MBC-11 vs PBS, p=0.015; e: MBC-29 vs PBS, p=0.09. Secondary analyses included f: Likelihood Ratio χ2 analyses across PBS and the two dose levels pooled for each compound: p=0.001; Two-tailed Fisher’s Exact tests: PBS vs etidronate, zoledronate and MBC-11: p=0.09, 0.003 and 0.017, respectively. NA: not applicable. The effects of MBC-1 and FUR on BMD change are shown in Supplemental Figure S3.
Figure 7
Figure 7. Kaplan-Meier survival curves of KAS-6/1-MIP1α-injected mice
Kaplan-Meier Survival Curves of animals treated with PBS, 0.04/4.0µg/day MBC-11, 0.04/4.0µg/day MBC-29, and the data pooled from the different control treatments (0.04/4.0µg/day AraC, etidronate, AraC+etidronate, and zoledronate). n: the number of mice analyzed for the respective group. Survival was significantly different across these treatment groups (Log-Rank: p=0.048). a: Log-Rank PBS vs MBC-11, p=0.047; b: Log-Rank PBS vs MBC-29, p=0.012. Kaplan-Meier survival curves for all treatments are presented in Supplemental Figure S4.

Similar articles

Cited by

References

    1. Coleman RE. Clinical features of metastatic bone disease and risk of skeletal morbidity. Clin Cancer Res. 2006;12(20 Pt 2):6243s–6249s. - PubMed
    1. Lipton A, Berenson JR, Body JJ, Boyce BF, Bruland OS, Carducci MA, Cleeland CS, Clohisy DR, Coleman RE, Cook RJ, Guise TA, Pearse RN, Powles TJ, Rogers MJ, Roodman GD, Smith MR, Suva LJ, Vessella RL, Weilbaecher KN, King L. Advances in treating metastatic bone cancer: summary statement for the First Cambridge Conference. Clin Cancer Res. 2006;12(20 Pt 2):6209s–6212s. - PMC - PubMed
    1. Aapro M, Abrahamsson PA, Body JJ, Coleman RE, Colomer R, Costa L, Crino L, Dirix L, Gnant M, Gralow J, Hadji P, Hortobagyi GN, Jonat W, Lipton A, Monnier A, Paterson AH, Rizzoli R, Saad F, Thurlimann B. Guidance on the use of bisphosphonates in solid tumours: recommendations of an international expert panel. Ann Oncol. 2008;19(3):420–432. - PubMed
    1. Body J-J. Bisphosphonates for malignancy-related bone disease: current status, future developments. Supportive Care in Cancer. 2006;V14(5):408–418. - PubMed
    1. Costa L. Bisphosphonates: reducing the risk of skeletal complications from bone metastasis. Breast. 2007;16 Suppl 3:S16–S20. - PubMed

Publication types

MeSH terms