. 2010 May 14;285(20):15380-15392.
doi: 10.1074/jbc.M109.071639. Epub 2010 Mar 16.

Requirement of the mTOR kinase for the regulation of Maf1 phosphorylation and control of RNA polymerase III-dependent transcription in cancer cells

Affiliations

Requirement of the mTOR kinase for the regulation of Maf1 phosphorylation and control of RNA polymerase III-dependent transcription in cancer cells

Boris Shor et al. J Biol Chem. .

Abstract

The mammalian target of rapamycin (mTOR) regulates growth via promoting translation and transcription. Here, employing an mTOR active-site inhibitor WYE-125132 (WYE-132), we have performed quantitative phospho-proteomics and identified a Ser-75-containing phosphopeptide from Maf1, a known repressor of RNA polymerase III (Pol III) transcription. Treatment of cancer cells with WYE-132 or the rapamycin analog CCI-779 led to a rapid loss of the phosphorylation at Ser-75, whereas this effect was not seen in cells treated with cytotoxic agents or unrelated inhibitors. WYE-132-induced Maf1 dephosphorylation correlated with its accumulation in the nucleus and a marked decline in the cellular levels of pre-tRNAs. Depletion of cellular Maf1 via small interfering RNA increased basal pre-tRNA and rendered tRNA synthesis refractory to mTOR inhibitors. Maf1 mutant proteins carrying S75A alone or with S60A, T64A, and S68A (Maf1-S75A, Maf1-4A) progressively enhanced basal repression of tRNA in actively proliferating cells and attenuated amino acid-induced tRNA transcription. Gene alignment revealed conservation of all four Ser/Thr sites in high eukaryotes, further supporting a critical role of these residues in Maf1 function. Interestingly, mTOR inhibition led to an increase in the occupancy of Maf1 on a set of Pol III-dependent genes, with concomitant reduction in the binding of Pol III and Brf1. Unexpectedly, mTORC1 itself was also enriched at the same set of Pol III templates, but this association was not influenced by mTOR inhibitor treatment. Our results highlight a new and unique mode of regulation of Pol III transcription by mTOR and suggest that normalization of Pol III activity may contribute to the therapeutic efficacy of mTOR inhibitors.


Figures

FIGURE 1.
FIGURE 1.
MS/MS spectra of Maf1 phosphopeptide identified by SILAC. The sequence of a tryptic peptide matched to Maf1 and the SILAC ratio (heavy-labeled/light-labeled (H/L)) for Maf1 peptide is shown for the corresponding spectra.
FIGURE 2.
FIGURE 2.
mTOR activity is required for Pol III transcription. A, MG63 (top), MDA361 (middle), or HEK293 (bottom) cells were treated with vehicle-DMSO, 0.5 μm CCI-779, 0.5 μm WYE-132, 5 μg/ml U0126, 10 μg/ml α-amanitin, or a 100 ng/ml taxol for 3 h. qRT-PCR analysis was used to measure the expression of tRNALeu (gray-shaded bars) or tRNATyr (open bars) precursors as described under “Experimental Procedures.” The expression levels of each gene were first normalized with control, glyceraldehyde-3-phosphate dehydrogenase (GAPDH). Data expressed as -fold differences over control untreated samples. The experiment was performed in triplicate. B, MG63 cells were transfected with control (C), mTOR, raptor, or rictor siRNA pools for 72 h as described under “Experimental Procedures.” Left, total lysates were immunoblotted with mTOR, raptor, rictor, P-S6K, P-AKT, and β-actin. Right, expression of precursor tRNALeu (shaded bars) or tRNATyr (striped bars) was measured by qRT-PCR. Glyceraldehyde-3-phosphate dehydrogenase was used for normalization. The values represent -fold differences in expression upon siRNA depletion relative to those of the control siRNA. The data shown are representative of three independent experiments. Error bars represent the range around the mean -fold changes as described under “Experimental Procedures.”
FIGURE 3.
FIGURE 3.
Effects of Maf1 knockdown on Pol III-dependent transcription and response to mTOR inhibitors. A, indicated tumor lines were transfected with siRNA pools specific for Maf1 or with control (Csi) for 72 h. Efficiency of the knockdown was measured by the qRT-PCR using the Taqman assay. Relative expression (%) is a percent mRNA remaining, which is calculated as the amount of Maf1 mRNA in Maf1-depleted cells compared with the non-targeting control siRNA samples. B, tRNALeu and tRNATyr precursor levels were quantified using qRT-PCR. The qRT-PCR results are presented as expression values relative to the control siRNA pool. Graphs are representative of three independent experiments. C, MG63 cells were transfected with Maf1 siRNA or control pools for 72 h, after which these cell populations were exposed to the vehicle-DMSO, 0.5 μm CCI-779, and WYE-132 for an additional 3 h. tRNALeu and tRNATyr levels were quantified using qRT-PCR.
FIGURE 4.
FIGURE 4.
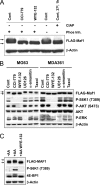
Maf1 phosphorylation status correlates with cellular mTOR signaling. A, MG63 cells were transfected with wild-type FLAG-Maf1 for 24 h and treated with vehicle-DMSO (Cont), 0.5 μm CCI-779, or 0.5 μm WYE-132 for an additional 3 h followed by lysis in NuPAGE-LDS buffer. For calf intestinal alkaline phosphatase (CIAP) treatment, total lysates from vehicle-treated cells were prepared in a buffer lacking phosphatase inhibitors (Phos Inh.) and treated for 1 h at 37 °C. Lysates were probed with FLAG or β-actin antibodies. B, indicated cell lines were transiently transfected FLAG-Maf1 expression vector. 24 h post-transfection cells were treated with 0.5 μm CCI-779, 0.5 μm WYE-132, 5 μg/ml U0126, 10 μg/ml α-amanitin, 100 ng/ml taxol, or DMSO-control for 3 h, as described in Fig. 2. Total cellular lysates were subjected to immunoblotting with antibodies for FLAG, phospho-S6K1, phospho-AKT, total AKT, phospho-ERK (extracellular signal-regulated kinase), and β-actin. Dephosphorylation of the Maf1 was monitored by its shift in migration on SDS-PAGE. The arrowheads indicate migration of the phosphorylated versus hypophosphorylated form of Maf1. C, HEK293 cells were subjected to amino acid withdrawal (−AA) for 2 h and then incubated with amino acids (+AA) for 1 h with or without WYE-132. Lysates were immunoblotted with FLAG, P-S6K1, total 4E-BP1, or β-actin antibodies.
FIGURE 5.
FIGURE 5.
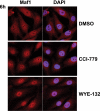
mTOR inhibitors cause nuclear accumulation of Maf1. MG63 cells were treated with 0.5 μm CCI-779 or 0.5 μm WYE-132 for 6 h. Merge with DAPI shows the localization of Maf1 in the nucleus. Left, cells were analyzed by immunofluorescence confocal microscopy using Maf1 antibody. Right, nuclei were counterstained with DAPI. Red, Alexa Fluor 594; Blue, DAPI.
FIGURE 6.
FIGURE 6.
Maf1 phospho-mutants decrease basal Pol III-dependent transcription. A, HEK293 cells were transiently transfected with either vector control, wild-type FLAG-Maf1 (Maf1-WT) or a mutant FLAG-Maf1-S75A (S75A). 24 h after the transfection cells were incubated in the absence (Mock) or presence of DMSO-control, 0.5 μm CCI-779, or 0.5 μm WYE-132 for 3 h. Samples were immunoblotted with FLAG antibodies. B–D, Maf1 was depleted from MG63 cells using 3′-UTR-targeting siRNA and either vector control (Csi), wild-type FLAG-Maf1 (Maf1-WT), or a mutant FLAG-Maf1-S75A (S75A) were re-expressed in these cells for 24 h as described under “Experimental Procedures.” B, control siRNA (Csi) or Maf1-depleted cells that were transfected with empty vector were tested for the level of Maf1 mRNA by qRT-PCR using a Maf1 Taqman assay. C, immunoblotting using FLAG antibody was used to confirm re-expression of Maf1 alleles and to monitor electrophoretic mobility of Maf1. Arrows indicate bands containing phosphorylated or dephosphorylated Maf1. D, precursor tRNALeu and tRNATyr levels in vehicle-treated cells from C were quantified using qRT-PCR. E, MG63 cells were transfected with the vectors expressing either FLAG-tagged wild-type Maf1 (WT), FLAG-Maf1-S75A (S75A), and a quadruple mutant FLAG-Maf1–4A (4A) after depletion of endogenous Maf1 with 3′-UTR-targeting siRNA. For the analysis of a relative shift in Maf1 mobility, cells were treated with 0.5 μm WYE-132 for 3 h. Top, total lysates were probed with FLAG and P-S6K1 antibodies. Arrows indicate phosphorylated or hypophosphorylated forms of Maf1. Bottom, qRT-PCR was then used to measure the amounts of precursor tRNALeu in cells expressing mutant alleles relative to cells containing wild-type Maf1.
FIGURE 7.
FIGURE 7.
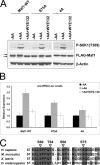
Maf1 phospho-mutants attenuate amino acid-stimulated Pol III transcription. A, HEK293 cells were transfected with wild-type FLAG-Maf1 (Maf1-WT), FLAG-Maf1-S75A (S75A), and a quadruple mutant FLAG-Maf1–4A (4A). Cells expressing Maf1 constructs were shifted to amino acid-free medium (−AA) for 2 h followed by 1 h of amino acid stimulation with (+AA+WYE-132) or without WYE-132 as described in Fig. 4C. Lysates were immunoblotted with FLAG, P-S6K1, total 4E-BP1, or β-actin antibodies. Arrows indicate phosphorylated or hypophosphorylated forms of Maf1. B, experiments are as in A; cells expressing Maf1 alleles were stimulated with amino acids in the presence or absence of WYE-132. Pre-tRNALeu levels were quantified using qRT-PCR. C, protein sequence alignment of the Maf1 region from different species is shown. Alignment and percentage identity shading was done with ClustalW2/Jalview (EMBL-EBI). Numbers designate amino acid positions. Dark gray residues show amino acids identical between all investigated species. Positions of phosphorylation sites are marked with triangles.
FIGURE 8.
FIGURE 8.
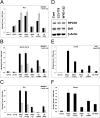
Effect of pharmacological inactivation of mTOR on Maf1, Pol III, Brf1, and mTORC1 occupancy at Pol III promoters. MG63 cells were treated with vehicle-DMSO or 0.5 μm WYE-132 for 3 h and processed for ChIP assays as described under “Experimental Procedures.” Chromatin from DMSO (black bars) or WYE-132 (gray shaded bars)-treated samples were immunoprecipitated with Maf1 (FL-256) (A), RPC39 (Pol III subunit) (B) or Brf1 (C) antibodies, and occupancy of the indicated regions was determined by qPCR. Untr12 is a negative-control genomic region. Values represent the averages of transcription binding events detected per 1000 Cells. Error bars represent S.D. of triplicate assays of an individual experiment. Graphs are representative of one of three independent experiments. D, MG63 cells were treated with vehicle (DMSO), 0.5 μm CCI-779, or 0.5 μm WYE-132 for 3 h. Lysates were subjected to the immunoblotting using RPC39, Brf1, or β-actin antibodies. E–F, quantitative ChIP analysis with mTOR (E), raptor (F), or control IgG antibodies is shown. Immunoprecipitated DNA was analyzed by qPCR using primers specific for the indicated regions as described in A–C.
FIGURE 9.
FIGURE 9.
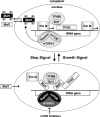
Schematic model depicting the role for mTOR-mediated phosphorylation of Maf1 in the regulation of Pol III transcription. Shown is a proposed mechanism whereby mTOR regulates Maf1 activity in cancer cells. Top, actively proliferating cells utilize mTOR-mediated phosphorylation of Maf1 to maintain optimal activity of Pol III apparatus. Bottom, inactivation of mTOR by pharmacological inhibitors or due to unfavorable growth conditions leads to enhanced nuclear retention of dephosphorylated Maf1 and repression of new rounds of Pol III synthesis.

Similar articles

Cited by

References

    1. Alessi D. R., Pearce L. R., García-Martínez J. M. (2009) Sci. Signal. 2, pe27. - PubMed
    1. Dunlop E. A., Tee A. R. (2009) Cell. Signal. 21, 827–835 - PubMed
    1. Guertin D. A., Sabatini D. M. (2007) Cancer Cell 12, 9–22 - PubMed
    1. Ma X. M., Blenis J. (2009) Nat. Rev. Mol. Cell Biol. 10, 307–318 - PubMed
    1. Engelman J. A. (2009) Nat. Rev. Cancer 9, 550–562 - PubMed

MeSH terms