. 2010 May 28;285(22):16893-911.
doi: 10.1074/jbc.M110.121947. Epub 2010 Mar 16.

Integration of general amino acid control and target of rapamycin (TOR) regulatory pathways in nitrogen assimilation in yeast

Affiliations

Integration of general amino acid control and target of rapamycin (TOR) regulatory pathways in nitrogen assimilation in yeast

Kirk A Staschke et al. J Biol Chem. .

Abstract

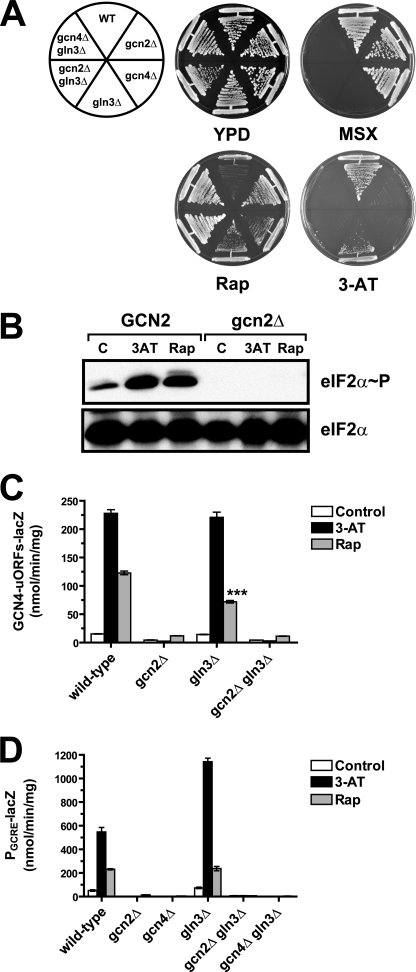
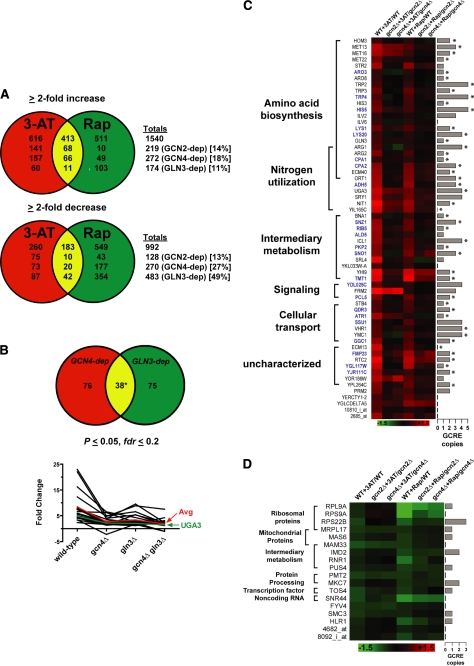
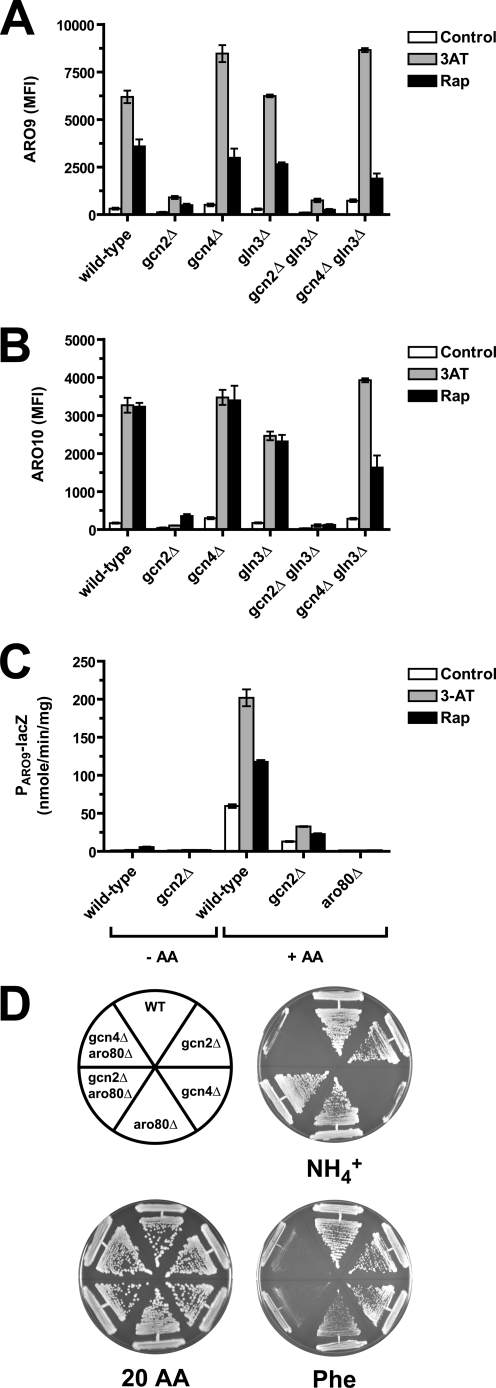
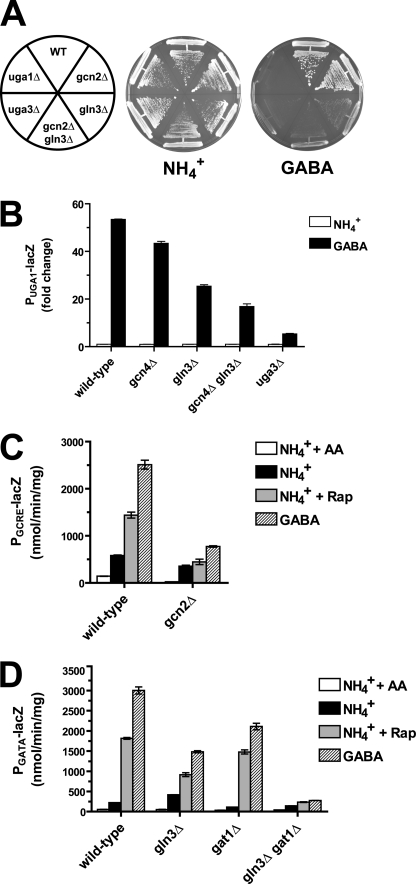
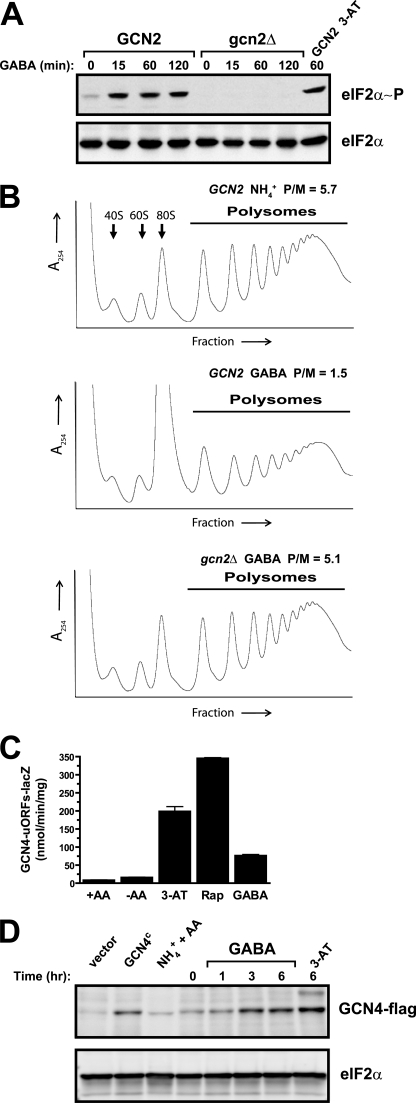
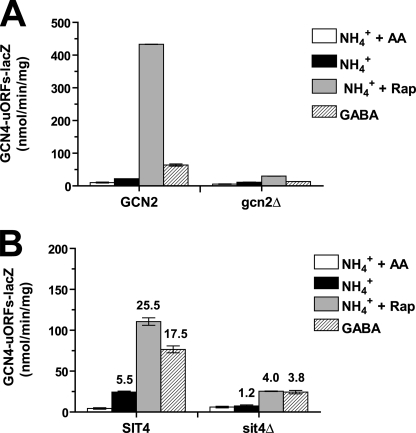
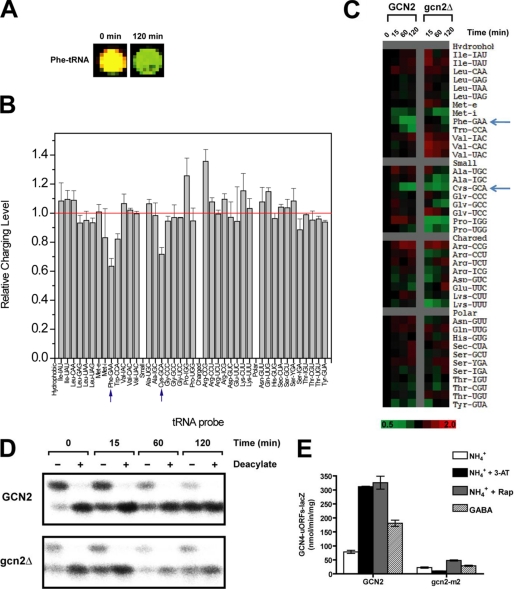
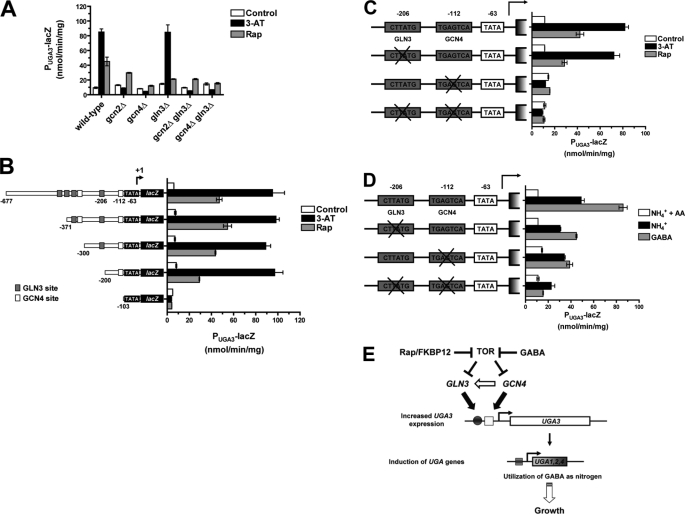
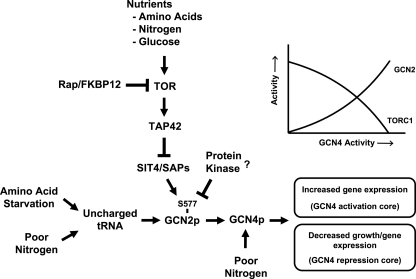
Two important nutrient-sensing and regulatory pathways, the general amino acid control (GAAC) and the target of rapamycin (TOR), participate in the control of yeast growth and metabolism during changes in nutrient availability. Amino acid starvation activates the GAAC through Gcn2p phosphorylation of translation factor eIF2 and preferential translation of GCN4, a transcription activator. TOR senses nitrogen availability and regulates transcription factors such as Gln3p. We used microarray analyses to address the integration of the GAAC and TOR pathways in directing the yeast transcriptome during amino acid starvation and rapamycin treatment. We found that GAAC is a major effector of the TOR pathway, with Gcn4p and Gln3p each inducing a similar number of genes during rapamycin treatment. Although Gcn4p activates a common core of 57 genes, the GAAC directs significant variations in the transcriptome during different stresses. In addition to inducing amino acid biosynthetic genes, Gcn4p in conjunction with Gln3p activates genes required for the assimilation of secondary nitrogen sources such as gamma-aminobutyric acid (GABA). Gcn2p activation upon shifting to secondary nitrogen sources is suggested to occur by means of a dual mechanism. First, Gcn2p is induced by the release of TOR repression through a mechanism involving Sit4p protein phosphatase. Second, this eIF2 kinase is activated by select uncharged tRNAs, which were shown to accumulate during the shift to the GABA medium. This study highlights the mechanisms by which the GAAC and TOR pathways are integrated to recognize changing nitrogen availability and direct the transcriptome for optimal growth adaptation.


Figures

FIGURE 1.
FIGURE 1.
GCN2 is required for increased Gcn4p transcriptional activity in response to rapamycin or 3-AT treatment. A, growth of prototrophic yeast strains was determined by streaking onto YPD agar medium or YPD containing 2 mm l-methionine sulfoximine (MSX) or 200 nm rapamycin (Rap) as indicated. Strains were also streaked on SC medium (lacking histidine) containing 30 mm 3-AT. WT, wild type. B, wild-type and gcn2Δ cells were treated with 10 mm 3-AT, 200 nm rapamycin, or no stress (C, control) for 1 h, and the levels of eIF2α phosphorylated specifically at serine 51 or total eIF2α were measured by immunoblot analyses. C, a GCN4-lacZ reporter plasmid (GCN4-uORF-lacZ) was introduced into wild-type cells or into cells deleted for GCN2 and/or GLN3 as indicated. ***, denotes a significant reduction (p < 0.001) in β-galactosidase activity in gln3Δ cells treated with rapamycin compared with wild-type control cells treated with rapamycin. D, yeast cells containing a PGCRE-lacZ reporter plasmid including the consensus GCRE were treated with 3-AT or rapamycin as listed in the legend. The average β-galactosidase activity from three independent cultures ± S.E. is shown.
FIGURE 2.
FIGURE 2.
Role of the GAAC and TOR in the changes in the yeast transcriptome following treatment with rapamycin or 3-AT. A, Venn diagrams illustrating the number of genes in which encoded mRNAs require GCN2, GCN4, or GLN3 for a 2-fold change in expression following 3-AT or rapamycin treatment. Red, indicates those gene transcripts changed only by 3-AT; green, those changed only in response to rapamycin treatment; yellow, those changed by both stress treatments. The total numbers of transcripts changed for each mutant and the percentage of the total number of different mRNAs changed in the wild-type strain are indicated at the right. B, top, Venn diagram illustrating the number of genes in which encoded mRNAs require GCN4 or GLN3 for a ≥2-fold increase following rapamycin exposure. Red, indicates those gene transcripts requiring only GCN4; green, those requiring only GLN3; yellow, those requiring both transcriptional regulators. Bottom, rapamycin-induced fold changes for gene transcripts in wild-type, gcn4Δ, gln3Δ, and gcn4Δ gln3Δ strains are plotted individually in black. The average fold change for all gene transcripts is shown in red, and the fold change values for UGA3 mRNA are highlighted in green. C and D, heat maps illustrate the levels of gene transcripts that require GCN4 for increased (C) or decreased (D) expression following treatment with 3-AT or rapamycin. Genes in the Gcn4p activation or repression core are listed along with their general biological functions. The legend at the bottom of the heat maps illustrates the changes in transcript levels between the paired samples listed at the top of each map. The number of GCREs present in each gene promoter region is represented to the right of the heat maps. In C, the asterisks indicate promoters reported to bind Gcn4p in chromatin immunoprecipitation (ChIP-chip) experiments (35); genes highlighted in blue were reported to have increased transcription in medium supplemented with secondary group B nitrogen compounds (38).
FIGURE 3.
FIGURE 3.
The GAAC and ARO80 are required for expression of aromatic catabolism genes. ARO9 (A) and ARO10 (B) mRNA levels were measured by microarray in wild-type cells or in cells deleted for GCN2, GCN4, or GLN3, individually or in combination, following treatment with 3-AT or rapamycin or no treatment (Control) as indicated. Transcript levels are plotted as mean fluorescence intensity (MFI). Changes in ARO9 and ARO10 mRNA levels were confirmed independently by quantitative RT-PCR (supplemental Fig. S5). C, wild-type (WY837), gcn2Δ (WY838), and aro80Δ (WY962) strains containing a PARO9-lacZ reporter plasmid were cultured in synthetic complete medium with (+AA) or without amino acids (−AA), as indicated, and treated with 3-AT or rapamycin or not treated (Control). β-Galactosidase activity was measured from two independent cultures and is presented as the mean ±S.E. D, prototrophic strains were grown on synthetic agar plates containing ammonia (NH4+), all 20 amino acids (20 AA), or Phe as the nitrogen source as indicated.
FIGURE 4.
FIGURE 4.
Gcn4p and Gln3p co-regulate gene expression in response to rapamycin treatment. A, a wild-type (WT) strain and those containing the indicated gene deletions were grown on synthetic agar plates containing either ammonia (NH4+) or GABA as the nitrogen source for 3 days at 30 °C. B, yeast cells deleted for GCN4, GLN3, and UGA3, as indicated, were transformed with a plasmid encoding a lacZ reporter gene fused to the UGA1 promoter. Cells were cultured in synthetic medium containing ammonia (NH4+) as the nitrogen source and then switched to synthetic medium containing 10 mm GABA as the nitrogen source for 6 h, and β-galactosidase activity was measured. The fold change in β-galactosidase activity from cells grown in GABA medium compared with those grown in ammonia from two independent cultures ± S.E. is shown. Values are normalized to the untreated control sample in wild-type cells. C, β-galactosidase activity was measured in wild-type and gcn2Δ cells encoding PGCRE-lacZ, which were grown in synthetic medium containing ammonia as the nitrogen source in the presence (NH4+ + AA) or absence (NH4+) of all 20 amino acids. Alternatively, cells were treated with 200 nm rapamycin (NH4+ + Rap) or grown in medium containing GABA as the nitrogen source for 6 h as indicated. D, wild-type and mutant cells containing a PGATA-lacZ reporter plasmid containing the consensus GATA element were grown and assayed as described for C.
FIGURE 5.
FIGURE 5.
Gcn2p phosphorylation of eIF2α reduces global translation and enhances GCN4 expression upon shifting to GABA medium. A, wild-type (GCN2) and gcn2Δ cells were grown in synthetic medium lacking amino acids and containing ammonia (NH4+) as the nitrogen source and then switched to minimal medium containing GABA as the nitrogen source and grown for up to 120 min as indicated. As a control, GCN2 cells were grown in ammonia containing medium supplemented with 3-AT for 60 min (GCN2 3-AT). A, levels of phosphorylated and total eIF2α were measured by immunoblot analyses. B, GCN2 and gcn2Δ cells were grown in medium containing ammonia (NH4+) or shifted to GABA medium for 1 h, and lysates were analyzed by sucrose gradient centrifugation. The panels show the A254 profile of the gradients, with free 40 S and 60 S subunits, 80 S ribosomes, and polysomes indicated. The profile for the gcn2Δ cells grown in synthetic medium with ammonia was not shown, as it was unchanged from the wild-type cells cultured in this medium. The ratio of polysomes (disomes or greater) compared with monosomes (P/M) is illustrated above each panel. C, β-galactosidase activity was measured from wild-type cells containing a GCN4-lacZ reporter plasmid with uORFs. Cells were grown in synthetic medium containing ammonia as the nitrogen source in the presence (+AA) or absence (−NH4+) of all 20 amino acids, or they were treated with 10 mm 3-AT or 200 nm rapamycin (Rap) or grown in medium containing GABA as the nitrogen source for 6 h as indicated. D, a low-copy plasmid p1025 encoding the GCN4 gene with an encoded carboxyl-terminal FLAG epitope for detection by immunoblot was introduced into the wild-type strain WY837. This plasmid contains the wild-type GCN4 promoter and encoded GCN4 uORFs. Cells were grown in synthetic medium with ammonia as the nitrogen source (0) or shifted to GABA medium for 1, 3, or 6 h. Alternatively, these cells were cultured in SD medium containing 3-AT for 6 h or in SC medium containing ammonia and all amino acids (NH4+ + AA). For controls, the WY837 strain containing vector alone or p1025, which expresses the GCN4 gene devoid of uORFs expressed from a constitutive ADH promoter (GCN4c), was cultured in SD medium. Equal amounts of protein lysates were analyzed by immunoblot using FLAG-specific antibody to visualize the tagged Gcn4p. In the lower panel, eIF2α protein was measured by immunoblot to show that equal amounts of total protein were analyzed in each of the lanes.
FIGURE 6.
FIGURE 6.
Increased GCN4 translation by the alternate nitrogen source GABA is dependent on Gcn2p and Sit4p. Wild-type (GCN2) and gcn2Δ (A) or sit4Δ (B) strains were cultured in synthetic medium lacking amino acids and containing ammonia (NH4+) as the nitrogen source and then switched to synthetic medium containing GABA as the nitrogen source and grown for 6 h as shown on the legend. β-Galactosidase activity was measured from the GCN2 and gcn2Δ cells containing a GCN4-lacZ reporter plasmid with uORFs (GCN4-uORFs-lacZ). The average β-galactosidase activity from three independent cultures ± S.E. is shown. In B, the fold change for the different medium conditions as compared with the synthetic medium containing ammonia and all amino acids (NH4+ + AA) is indicated above each histogram.
FIGURE 7.
FIGURE 7.
Increased uncharged tRNA levels in cells shifted to GABA medium. The protrophic strain WY798 and its isogenic gcn2Δ counterpart (WY799) were cultured in SD medium and then shifted to synthetic medium containing GABA as the sole nitrogen source for 15, 30, and 120 min. The genome-wide charging of tRNA was measured using the microarray method. A, scanned fluorescent images of tRNAPhe hybridized to the complementary probe in the microarrays. The tRNA preparations were cultured in SD medium (0 min) or GABA medium for 120 min. Yellow represents no change in the charging of tRNAPhe, and green indicates low tRNA charging. B, the relative levels of tRNA charging are presented as the ratio of each charged tRNA prepared from the wild-type strain cultured in GABA medium for 60 min compared with those cultured in SD medium. The x axis lists each of the different tRNAs collated into hydrophobic, small, charged, and polar groups. The value of 1.0 in the y axis indicates that the tRNA charging in cells cultured in GABA is equal to that in the SD control. Values less than 1.0 indicate reduced tRNA charging, and values greater than 1.0 denote tRNA charging that is greater upon shift of the cells to GABA medium. Error bars represent ±S.E. C, heat map representation of genome-wide tRNA charging in response a shift to GABA medium. The levels of tRNA charging were measured in the GCN2 and gcn2Δ strains upon shifting to GABA medium for 15, 60, and 120 min. Those cells that were shifted to SD medium as a control are represented as 0 min. Green indicates decreased tRNA charging in the GABA medium compared with the SD control, and red represents enhanced tRNA charging, as listed on the scale to the right of the figures. D, Northern blot analysis of acid-denaturing gels measuring the charging of tRNAPhe in the GCN2 and gcn2Δ strains upon shifting the cultures from SD medium to GABA medium for up to 120 min as indicated. The panels comprise an autoradiogram representing hybridization of a radiolabeled probe complementary to charged (slower migrating band) and uncharged (faster migrating band) tRNAPhe. As a control, the tRNAPhe was deacylated prior to Northern analysis (+) and compared with samples that were not subjected to deacylation in vitro prior to Northern analysis (−). E, strain RY139 (gcn2Δ) containing plasmid pYB41 encoding a GCN4-lacZ reporter with uORFs intact was transformed with a low-copy plasmid encoding GCN2, mutant gcn2-m2, or vector alone. Cells grown in synthetic medium containing ammonia as the nitrogen source (NH4+) were treated with 10 mm 3-AT (NH4+ + 3-AT) or 200 mm rapamycin (NH4+ + Rap), or grown in medium containing GABA as the nitrogen source for 6 h. The average β-galactosidase activity measured from three independent cultures ± S.E. is shown.
FIGURE 8.
FIGURE 8.
Gcn4p and Gln3p co-regulate the UGA3 promoter. A, a PUGA3-lacZ reporter plasmid was introduced into wild-type cells or into cells deleted for GCN2, GCN4, or GLN3, individually or in combination, as indicated. Cells were cultured in synthetic complete medium supplemented with all amino acids except histidine, treated with 3-AT or rapamycin (Rap), or not treated (Control) for 6 h, and β-galactosidase activity was measured. The average β-galactosidase activity from two independent cultures ± S.E. is shown. B, wild-type cells containing a lacZ reporter gene under the control of the UGA3 promoter (−677) or a deletion of the UGA3 promoter (−371, −300, −200, or −103), as indicated, were cultured and treated as described in A. The predicted Gln3p and Gcn4p binding sites in the UGA3 promoter are indicated. C, the consensus Gln3p (GATA) and Gcn4p (GCRE) binding sites present in the minimal UGA3 promoter at −206 and −112, respectively, were mutated by site-directed mutagenesis, as indicated. Wild-type cells containing a lacZ reporter gene under the control of the wild-type minimal UGA3 promoter (−300) were cultured and analyzed as described in A. Alternatively, a minimal promoter containing mutant Gln3p (GATA) and Gcn4p (GCRE) binding sites, individually or in combination, was analyzed. D, wild-type cells containing PUGA3-lacZ reporter genes as described in C were cultured in synthetic medium containing ammonia as the nitrogen source in the presence of all 20 amino acids (NH4+ + AA) or the absence of all 20 amino acids (NH4+) or were grown in medium containing GABA as the nitrogen source for 6 h as indicated. E, model depicting the role of TOR-mediated regulation of Gln3p and Gcn4p in the control of UGA3 mRNA expression, which impacts the subsequent utilization of GABA as a nitrogen source in yeast.
FIGURE 9.
FIGURE 9.
The role of the general amino acid control pathway in TOR-regulated gene expression. Model depicting the role of GAAC in TOR-regulated gene expression including genes in the Gcn4p-dependent activation core and repression core. The top right panel illustrates a model wherein enhanced Gcn2p activity contributes to elevated Gcn4p transcriptional function. Conversely, TOR signaling serves to repress the GAAC, with elevated Gcn4p function occurring with lowered TORC1 activity.

Similar articles

Cited by

References

    1. Hinnebusch A. G. (1997) J. Biol. Chem. 272, 21661–21664 - PubMed
    1. Hinnebusch A. G. (2005) Annu. Rev. Microbiol. 59, 407–450 - PubMed
    1. Wek R. C., Staschke K. A., Narasimhan J. (2004) Topics in Current Genetics: Nutrient-induced Responses in Eukaryotic Cells (Winderickx J. G., Taylor P. M. eds) pp. 177–199, Springer, Berlin/Heidelberg
    1. Wek R. C., Jackson B. M., Hinnebusch A. G. (1989) Proc. Natl. Acad. Sci. U. S. A. 86, 4579–4583 - PMC - PubMed
    1. Natarajan K., Meyer M. R., Jackson B. M., Slade D., Roberts C., Hinnebusch A. G., Marton M. J. (2001) Mol. Cell. Biol. 21, 4347–4368 - PMC - PubMed

Publication types

MeSH terms