. 2010 Jun 4;285(23):17974-85.
doi: 10.1074/jbc.M109.084616. Epub 2010 Mar 16.

Mammalian numb-interacting protein 1/dual oxidase maturation factor 1 directs neuronal fate in stem cells

Affiliations

Mammalian numb-interacting protein 1/dual oxidase maturation factor 1 directs neuronal fate in stem cells

Karen A M Kennedy et al. J Biol Chem. .

Abstract

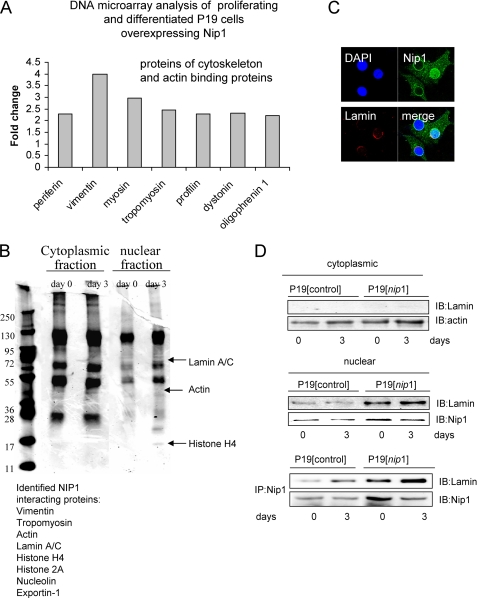
In this study, we describe a role for the mammalian Numb-interacting protein 1 (Nip1) in regulation of neuronal differentiation in stem cells. The expression of Nip1 was detected in the developing mouse brain, embryonic stem cells, primary neuronal stem cells, and retinoic acid-treated P19 embryonal carcinoma cells. The highest expression of Nip1 was observed in undifferentiated neuronal stem cells and was associated with Duox1-mediated reactive oxygen species ROS production. Ectopic nip1 expression in P19 embryonal carcinoma cells induced neuronal differentiation, and this phenotype was also linked to elevated ROS production. The neuronal differentiation in nip1-overexpressing P19 cells was achieved in a retinoic acid-independent manner and was corroborated by an increase in the expression of the neuronal basic helix-loop-helix transcription factors and neural-lineage cell markers. Furthermore, depletion of nip1 by short hairpin RNA led to a decrease in the expression of neuronal basic helix-loop-helix transcription factors and ROS. However, inhibition of ROS production in nip1-overexpressing P19 cells restricted but did not extinguish neuronal differentiation. Microarray and mass spectrometry analysis identified intermediate filaments as the principal cytoskeletal elements affected by up-regulation of nip1. We show here the first evidence for a functional interaction between Nip1 and a component of the nuclear lamina, lamin A/C. associated with a neuronal-specific phenotype. Taken together, our data reveal an important role for Nip1 in the guidance of neuronal differentiation through ROS generation and modulation of intermediate filaments and implicate Nip1 as a novel intrinsic regulator of neuronal cell fate.


Figures

FIGURE 1.
FIGURE 1.
Expression analysis of Nip1 in mouse brain. A, shown is detection of the nip1 and nip2 transcripts in mouse (m) tissues as determined by RT-PCR. B, temporal expression pattern of Nip1 in mouse embryos from embryonic day 7 to embryonic day 17 are shown. The expression levels were based on qRT-PCR data obtained from a pool of embryos for each day. C, detection of Nip1 protein in mouse brain is shown. Western blot analysis of total protein extract from brain at embryonic day 18 (E18) and postnatal days 1 (P1) and 7 (P7) is shown. D and E, immunostaining of coronal sections from E10.5 brains with anti-Nip1 and anti-tubulin III antibodies. The nuclei on the section were stained by hematoxylin. Higher magnifications of the boxed regions are shown in D and E. F, temporal expression patterns of neurogenin1 and neuroD in mouse embryos of E7, E11, and E15 are shown. G, temporal expression patterns of nip, brachyuryT, and hes1 in mouse embryos are shown. The expression levels were based on qRT-PCR data and are shown as -fold changes over their respective levels at E7. An error bar represents the S.D. of duplicates from a pool of embryos.
FIGURE 2.
FIGURE 2.
Up-regulation of Nip1 precedes neuronal differentiation in stem cells. A, shown is nip1 expression in stem cells and mouse embryos as examined by qRT-PCR. The transcript levels of nip1 were normalized to that of glyceraldehyde-3-phosphate dehydrogenase and then compared with the level of nip1 mRNA of the mouse embryo at E7. B, anti-Nip1 immunofluorescence images of mouse primary NS cells and P19 EC cells are shown. Magnification is 6300×. C, the expression of nip1 and neuroD during differentiation of primary neural stem cells was examined by qRT-PCR; p < 0.05 (*) and p < 0.001 (**)compared with day 0. D, Western blot analysis of Nip1, Duox1, and βIII-tubulin in differentiated and undifferentiated primary neural stem cells is shown. E, the relative protein level, determined by densitometry of the WB bands, for Nip1 on day 5 of differentiation was compared with that on day 0. The level of Nip1 was normalized to that of actin before the comparison; **, p < 0.001 versus day 0. An error bar represents the S.D. of three independent experiments. F, a temporal pattern of nip1 expression during RA-induced neuronal differentiation of P19 cells as assessed by qRT-PCR is shown. Expression levels are shown as -fold changes over the level of nip1 on day 0. An error bar represents the S.D. of two independent experiments. G, shown is the temporal pattern of nip1 expression during mouse ES cell differentiation determined by qRT-PCR. PCR was performed in triplicates for three biological replicates. H, P19 cells were aggregated in the absence and presence of 1 μm RA to induce neuronal differentiation and with DMSO alone or DMSO with RA to induce myogenic differentiation. Cells were harvested for RNA at the indicated time points. The induction of neurogenesis in RA-treated cultures was confirmed by an up-regulation in the neuronal specific marker βIII-tubulin. I, shown is expression of neurogenin1 and neuroD on day 2 of RA-induced neuronal differentiation of P19 cells relative to day 0. An error bar represents the S.D. of two independent experiments.
FIGURE 3.
FIGURE 3.
Ectopic expression of Nip1 results in induction of neuronal differentiation in P19 cells. A, shown is an anti-Nip1 Western blot showing enhanced Nip1 level in P19 cells stably transfected with a nip1-myc expression vector. B, a comparison is shown of expression levels between P19[nip1] clones and P19 control cells for nip1, duox1, hes, sox2, neurogenin1, and neurogenin 2 before differentiation. C, shown is a comparison of expression levels between P19[nip1] clones and P19 control cells for nip1, duox1, neurogenin1, neurogenin 2, math3, neuroD, and neurofilament on day 3 of differentiation in the absence of RA. Graphs were based on qRT-PCR data. Expression levels were normalized to that of glyceraldehyde-3-phosphate dehydrogenase. An error bar represents the S.D. of two independent experiments. D, P19[nip1] transformants or P19[control] cells were aggregated without RA. Immunofluorescence images of Anti-βIII-tubulin (red) and anti-Nip1 (green) followed by 4′,6-diamidino-2-phenylindole (DAPI, blue) staining for the nucleus in P19[control] and P19[nip1] cells on day 3 of aggregation. Magnification is 6300×. E, an anti-βIII-tubulin Western blot (IB) on days 0 and 3 of aggregation is shown. F, quantification of cells showing positive immunostain for β-III tubulin in P19[nip1] transformants or P19[control] cells on day 3 of aggregation. Cells were also immunostained for neurofilament or DCX on days 0, 3, and 7. Cells were then examined by flow cytometry to evaluate the populations of cells that expressed neurofilament (G) or DCX (H); **, p < 0.001 versus P19[control]. An error bar represents the S.D. of three-five independent experiments.
FIGURE 4.
FIGURE 4.
Undifferentiated NS cells and P19[nip1] stable transformants display enhanced levels of intracellular ROS. A, a Western blot shows coimmunoprecipitation (IP) of Nip1 and Duox1 on day 0 and day 5 of NS cell differentiation. B, shown is quantification of ROS production in neuronal stem cells undergoing differentiation. Release of hydrogen peroxide was detected using Amplex Red; **, p < 0.001 versus day 0. Statistics were Student's t test. C, a Western blot shows co-immunoprecipitation of Nip1 and Duox1 in P19[nip1] transformants and P19[control] cells on day 0. D, representative flow cytometry histogram shows the distribution of DCF fluorescence in clonal population of P19[nip1] transformants and P19[control] cells on day 0. E, the H2O2 concentration was measured by incubating cells with 2′,7′-dichlorodihydrofluorescein diacetate followed by flow cytometry gated on DCF fluorescence. An error bar represents the S.D. of 3–5 independent experiments; **p < 0.001 compared with P19[control]. Statistics were Student's t tests. F, a representative flow cytometric histogram shows ROS levels assessed by DCF staining in P19[nip1] and P19 [control] clones treated or not with diphenyleneiodonium chloride (DPI) for 30 min. The histogram is representative of three independent analyses.
FIGURE 5.
FIGURE 5.
Enhanced superoxide levels contribute to neuronal differentiation of P19[nip1] stable transformants. A, shown is quantification of hydroethidine (HE) fluorescence in P19[nip1] transformants versus control cells at days 0 and 3 of aggregation. An error bar represents the S.D. of data obtained from three P19[nip1] clonal populations; *, p < 0.01 versus P19[control]. B, a qRT-PCR analysis shows the effect of MnTBAP on the neurofilament mRNA transcript level in P19[nip1] and P19[control] cells on day 3 of aggregation without RA. C, a representative neurofilament immunofluorescence image shows the inhibitory effect of MnTBAP on neurogenesis by P19[nip1] cells. Images were obtained from cells on day 7 of aggregation. Magnification is 400×.
FIGURE 6.
FIGURE 6.
Depletion of Nip1 leads to impairment of neuronal differentiation in P19 cells. A, P19[nip1-shRNA] or P19[scrRNA] transfectants were aggregated with RA, and the mRNA levels of nip1, neurogenin1, neurogenin2, and neuroD were quantified by qRT-PCR on day 2. B, a representative flow cytometric histogram shows changes in Nip1 expression in P19 cells transiently transfected with nip1-specific shRNA or scrRNA. This histogram is representative of three independent analysis. C, shown is a Western blot analysis of Nip1 in P19[nip1-shRNA] or P19[scrRNA] cells. D, P19[nip1-shRNA] or P19[scrRNA] cells were aggregated in the presence of RA and assessed for neurogenesis on day 2 by immunofluorescence against βIII-tubulin or neurofilament (NF). Shown on the graph are the immunofluorescence in P19[nip1-shRNA] cells relative to the corresponding immunofluorescence signals in the P19[scrRNA] control cells; *, p < 0.01 versus P19[scrRNA]. Statistics were from Student's t test. E, shown is analysis of doublecortin expression in P19[nip1-shRNA] or P19[scrRNA] cells on day 2 of aggregation in the presence of RA. F, DCF fluorescence flow cytometry signals (measure of ROS) in P19[nip1-shRNA and P19[scrRNA] cells are shown. G, shown is a graphical representation of reduced ROS production in Nip1-knockdown cells. *, p < 0.01 versus P19[scrRNA]. An error bar represents the S.D. of three-four independent experiments.
FIGURE 7.
FIGURE 7.
Identification of transcriptional targets and interaction partners of Nip1 in P19 cells. A, shown is an increase in expression of transcripts associated with cytoskeleton in differentiating P19[nip1] and P19[control] cells as measured by DNA microarray analysis. Genes that were 2-fold or more up-regulated and had a p value <0.05 by t test were identified as significantly changed. B, Nip-1 immunoprecipitates were resolved by one-dimensional electrophoresis and stained with Coomassie Brilliant Blue. Bands were cut out and subjected to in-gel trypsin digestion before mass spectrometric analysis. C, Nip1 and lamin A/C were co-expressed and co-localized in P19 cells overexpression Nip1. Cells were immunostained with anti-Nip-1 (green) and anti-lamin A/C (red) followed by 4′,6-diamidino-2-phenylindole (DAPI, blue) staining for nuclear. D, Western blot analysis (IB) is shown of lamin A/C in nuclear extracts of undifferentiated and differentiated P19[nip1] and P19[control] cells. Magnification is 6300×. Coimmunoprecipitation of lamin A/C and Nip1 was examined in vector control and Nip1-overexpressing P19 cells at day 0 and day 3 of differentiation in the absence of RA. The cell extracts were immunoprecipitated (IP) with anti-Nip1 antibody and probed with antibodies to lamin A/C.
FIGURE 8.
FIGURE 8.
The role of lamin A/C in Nip1 mediated neuronal differentiation. A, P19 cells show a decrease in expression of doublecortin in P19 cells transfected with nip1-specific shRNA, lamin A/C-specific shRNA, or a scrambled shRNA. A representative flow cytometric histogram shows changes in lamin A/C and doublecortin expression in P19[nip1-shRNA and P19[scrRNA] cells. These histograms are representative of three independent analyses. B, changes in βIII tubulin expression in P19[nip1] and P19[control] cells transiently transfected with lamin A/C-specific shRNA or a scrambled shRNA are shown. C, shown is a Western blot analysis of lamin A/C. D, shown is a proposed model of regulation of Nip1-mediated differentiation.

Similar articles

Cited by

References

    1. Johnson J. E., Birren S. J., Anderson D. J. (1990) Nature 346, 858–861 - PubMed
    1. Guillemot F., Lo L. C., Johnson J. E., Auerbach A., Anderson D. J., Joyner A. L. (1993) Cell 75, 463–476 - PubMed
    1. Akazawa C., Ishibashi M., Shimizu C., Nakanishi S., Kageyama R. (1995) J. Biol. Chem. 270, 8730–8738 - PubMed
    1. Ma Q., Kintner C., Anderson D. J. (1996) Cell 87, 43–52 - PubMed
    1. Sommer L., Ma Q., Anderson D. J. (1996) Mol. Cell. Neurosci. 8, 221–241 - PubMed

Publication types