Increased receptor stimulation elicits differential calcium-sensing receptor(T888) dephosphorylation
- PMID: 20233724
- PMCID: PMC2863175
- DOI: 10.1074/jbc.M109.071084
Increased receptor stimulation elicits differential calcium-sensing receptor(T888) dephosphorylation
Abstract
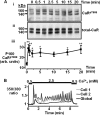
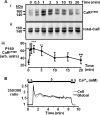
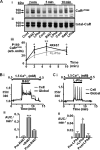
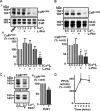
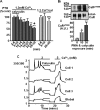
The calcium-sensing receptor (CaR) elicits oscillatory Ca(2+)(i) mobilization associated with dynamic, inhibitory protein kinase C-mediated phosphorylation of CaR(T888). While modest CaR stimulation elicits Ca(2+)(i) oscillations, greater stimulation either increases oscillation frequency or elicits sustained responses by an unknown mechanism. Here, moderate CaR stimulation (2.5 mm Ca(2+)(o), 10 min) increased CaR(T888) phosphorylation (160-kDa mature receptor) 5-fold in CaR stably transfected HEK-293 cells, whereas 3-5 mm Ca(2+)(o) treatments were without apparent effect. Treatment with 2 mm Ca(2+)(o) caused sustained CaR(T888) phosphorylation (> or = 20 min) and oscillatory Ca(2+)(i) mobilization. However, 5 mm Ca(2+)(o) increased CaR(T888) phosphorylation only briefly while eliciting sustained Ca(2+)(i) mobilization, suggesting that greater CaR activation induces rapid CaR(T888) dephosphorylation, thus permitting sustained Ca(2+)(i) responses. Indeed, 5 mm Ca(2+)(o) stimulated protein phosphatase 2A activity and induced CaR(T888) dephosphorylation following acute phorbol ester pretreatment, the latter effect being mimicked by CaR-positive allosteric modulators (NPS-R467 and l-Phe). Finally, the phosphatase inhibitor calyculin-A reversed CaR-induced inhibition of parathyroid hormone secretion from bovine parathyroid slices and normal human parathyroid cells, demonstrating the physiological importance of phosphorylation status on parathyroid function. Therefore, high Ca(2+)(o)-stimulated protein kinase C acts in concert with high Ca(2+)(o)-induced phosphatase activity to generate and maintain CaR-induced Ca(2+)(i) oscillations via the dynamic phosphorylation and dephosphorylation of CaR(T888).
Figures



Similar articles
-
Protein kinase C-mediated phosphorylation of the calcium-sensing receptor is stimulated by receptor activation and attenuated by calyculin-sensitive phosphatase activity.J Biol Chem. 2007 May 18;282(20):15048-56. doi: 10.1074/jbc.M607469200. Epub 2007 Mar 21. J Biol Chem. 2007. PMID: 17376781
-
Involvement of protein kinase C-alpha and -epsilon in extracellular Ca(2+) signalling mediated by the calcium sensing receptor.Exp Cell Res. 2004 Jul 15;297(2):560-73. doi: 10.1016/j.yexcr.2004.03.039. Exp Cell Res. 2004. PMID: 15212956
-
Pathophysiologic Changes in Extracellular pH Modulate Parathyroid Calcium-Sensing Receptor Activity and Secretion via a Histidine-Independent Mechanism.J Am Soc Nephrol. 2015 Sep;26(9):2163-71. doi: 10.1681/ASN.2014070653. Epub 2015 Jan 2. J Am Soc Nephrol. 2015. PMID: 25556167 Free PMC article.
-
Calcium sensing receptors and calcium oscillations: calcium as a first messenger.Curr Top Dev Biol. 2006;73:85-114. doi: 10.1016/S0070-2153(05)73003-9. Curr Top Dev Biol. 2006. PMID: 16782456 Review.
-
New concepts in calcium-sensing receptor pharmacology and signalling.Br J Pharmacol. 2012 Jan;165(1):35-48. doi: 10.1111/j.1476-5381.2011.01511.x. Br J Pharmacol. 2012. PMID: 21627634 Free PMC article. Review.
Cited by
-
Engendering biased signalling from the calcium-sensing receptor for the pharmacotherapy of diverse disorders.Br J Pharmacol. 2014 Mar;171(5):1142-55. doi: 10.1111/bph.12420. Br J Pharmacol. 2014. PMID: 24111791 Free PMC article. Review.
-
International Union of Basic and Clinical Pharmacology. CVIII. Calcium-Sensing Receptor Nomenclature, Pharmacology, and Function.Pharmacol Rev. 2020 Jul;72(3):558-604. doi: 10.1124/pr.119.018531. Pharmacol Rev. 2020. PMID: 32467152 Free PMC article. Review.
-
Phosphate acts directly on the calcium-sensing receptor to stimulate parathyroid hormone secretion.Nat Commun. 2019 Oct 16;10(1):4693. doi: 10.1038/s41467-019-12399-9. Nat Commun. 2019. PMID: 31619668 Free PMC article.
-
Calcium-Sensing Receptors Control CYP27B1-Luciferase Expression: Transcriptional and Posttranscriptional Mechanisms.J Endocr Soc. 2021 Jun 5;5(9):bvab057. doi: 10.1210/jendso/bvab057. eCollection 2021 Sep 1. J Endocr Soc. 2021. PMID: 34337274 Free PMC article.
-
The Different Facets of Extracellular Calcium Sensors: Old and New Concepts in Calcium-Sensing Receptor Signalling and Pharmacology.Int J Mol Sci. 2018 Mar 27;19(4):999. doi: 10.3390/ijms19040999. Int J Mol Sci. 2018. PMID: 29584660 Free PMC article. Review.
References
-
- Brown E. M., Gamba G., Riccardi D., Lombardi M., Butters R., Kifor O., Sun A., Hediger M. A., Lytton J., Hebert S. C. (1993) Nature 366, 575–580 - PubMed
-
- Brown E. M., MacLeod R. J. (2001) Physiol. Rev. 81, 239–297 - PubMed
-
- Nemeth E. F., Wallace J., Scarpa A. (1986) J. Biol. Chem. 261, 2668–2674 - PubMed
-
- Morrissey J. J. (1988) Am. J. Physiol. 254, E63–E70 - PubMed
Publication types
MeSH terms
Substances
Grants and funding
LinkOut - more resources
Full Text Sources
Molecular Biology Databases
Miscellaneous

