

Functional muscle analysis of the Tcap knockout mouse
- PMID: 20233748
- PMCID: PMC2865379
- DOI: 10.1093/hmg/ddq105
Functional muscle analysis of the Tcap knockout mouse
Abstract
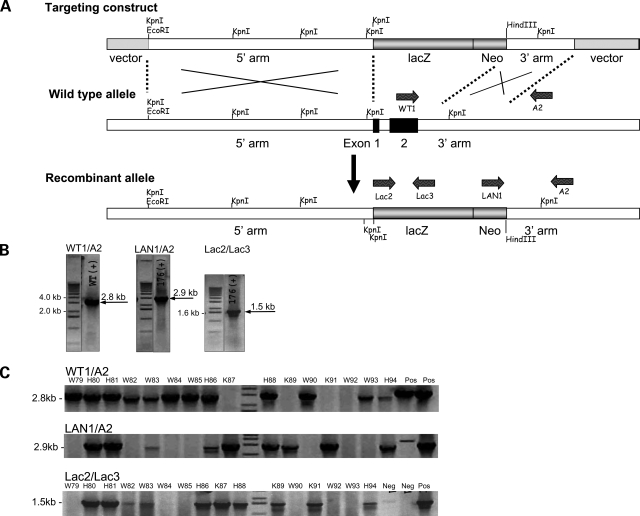
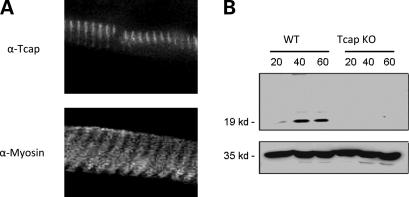
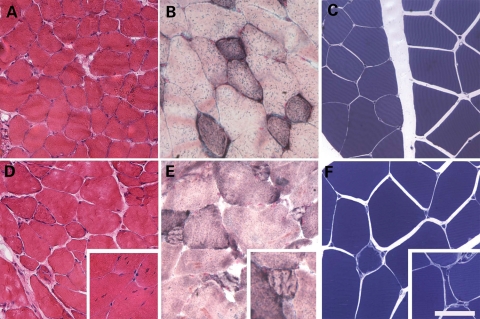
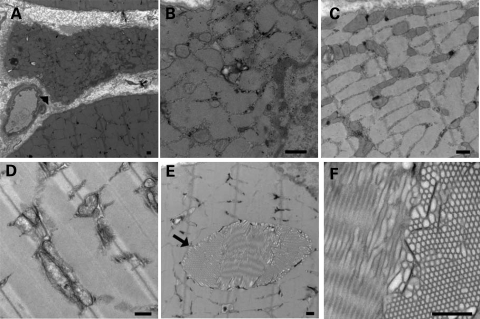
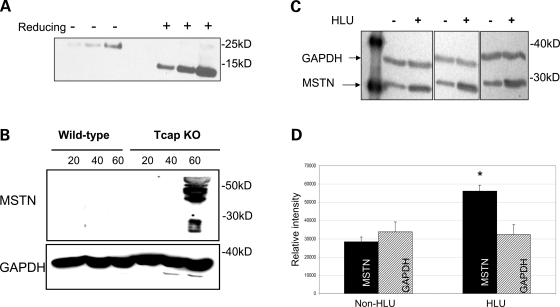
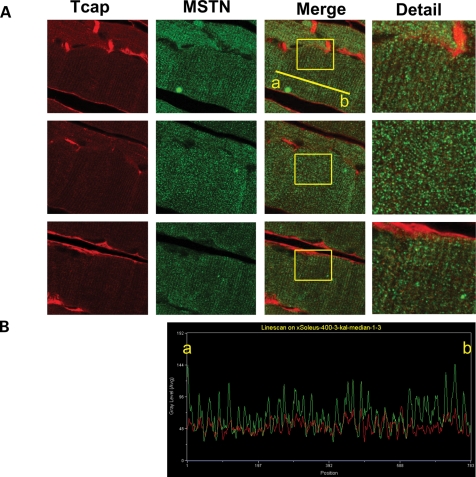
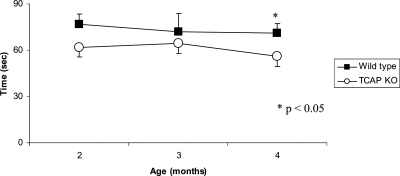
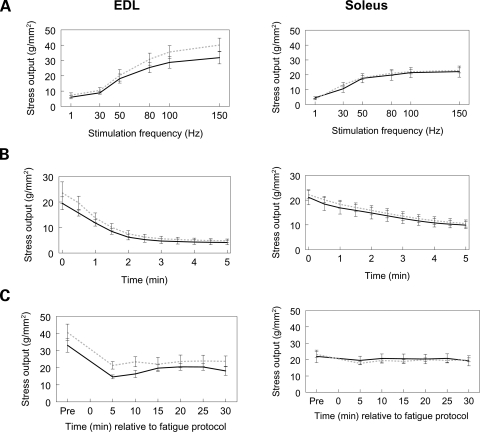
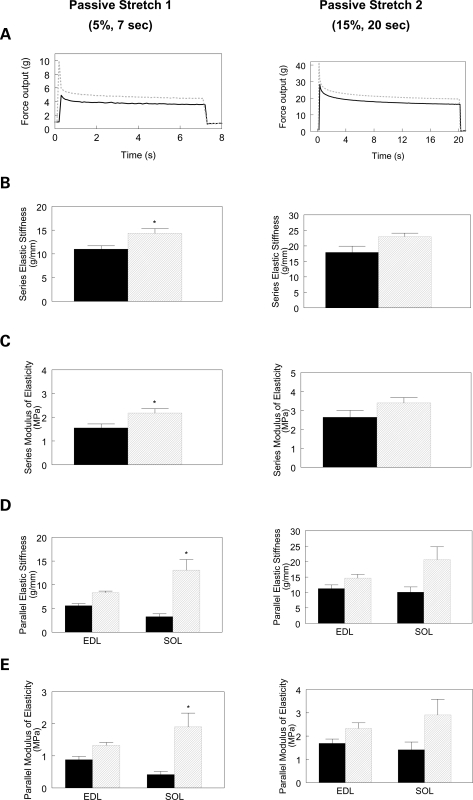
Autosomal recessive limb-girdle muscular dystrophy type 2G (LGMD2G) is an adult-onset myopathy characterized by distal lower limb weakness, calf hypertrophy and progressive decline in ambulation. The disease is caused by mutations in Tcap, a z-disc protein of skeletal muscle, although the precise mechanisms resulting in clinical symptoms are unknown. To provide a model for preclinical trials and for mechanistic studies, we generated knockout (KO) mice carrying a null mutation in the Tcap gene. Here we present the first report of a Tcap KO mouse model for LGMD2G and the results of an investigation into the effects of Tcap deficiency on skeletal muscle function in 4- and 12-month-old mice. Muscle histology of Tcap-null mice revealed abnormal myofiber size variation with central nucleation, similar to findings in the muscles of LGMD2G patients. An analysis of a Tcap binding protein, myostatin, showed that deletion of Tcap was accompanied by increased protein levels of myostatin. Our Tcap-null mice exhibited a decline in the ability to maintain balance on a rotating rod, relative to wild-type controls. No differences were detected in force or fatigue assays of isolated extensor digitorum longus (EDL) and soleus (SOL) muscles. Finally, a mechanical investigation of EDL and SOL indicated an increase in muscle stiffness in KO animals. We are the first to establish a viable KO mouse model of Tcap deficiency and our model mice demonstrate a dystrophic phenotype comparable to humans with LGMD2G.
Figures
Similar articles
-
Distal myopathy due to TCAP variants in four unrelated Chinese patients.Neurogenetics. 2021 Mar;22(1):1-10. doi: 10.1007/s10048-020-00623-4. Epub 2020 Aug 6. Neurogenetics. 2021. PMID: 32761539
-
AAV-based TCAP delivery rescues mitochondria dislocation in limb-girdle muscular dystrophy R7.Brain. 2025 May 13;148(5):1680-1694. doi: 10.1093/brain/awae351. Brain. 2025. PMID: 39468783
-
Depletion of zebrafish Tcap leads to muscular dystrophy via disrupting sarcomere-membrane interaction, not sarcomere assembly.Hum Mol Genet. 2009 Nov 1;18(21):4130-40. doi: 10.1093/hmg/ddp362. Epub 2009 Aug 12. Hum Mol Genet. 2009. PMID: 19679566 Free PMC article.
-
A new case of limb girdle muscular dystrophy 2G in a Greek patient, founder effect and review of the literature.Neuromuscul Disord. 2018 Jun;28(6):532-537. doi: 10.1016/j.nmd.2018.04.006. Epub 2018 Apr 13. Neuromuscul Disord. 2018. PMID: 29759638 Review.
-
Animal models for genetic neuromuscular diseases.J Mol Neurosci. 2008 Mar;34(3):241-8. doi: 10.1007/s12031-007-9023-9. Epub 2008 Jan 18. J Mol Neurosci. 2008. PMID: 18202836 Review.
Cited by
-
Distal myopathy due to TCAP variants in four unrelated Chinese patients.Neurogenetics. 2021 Mar;22(1):1-10. doi: 10.1007/s10048-020-00623-4. Epub 2020 Aug 6. Neurogenetics. 2021. PMID: 32761539
-
Circadian regulation of cardiac muscle function and protein degradation.Chronobiol Int. 2023 Jan;40(1):4-12. doi: 10.1080/07420528.2021.1957911. Epub 2021 Sep 14. Chronobiol Int. 2023. PMID: 34521283 Free PMC article.
-
Cytoskeletal protein kinases: titin and its relations in mechanosensing.Pflugers Arch. 2011 Jul;462(1):119-34. doi: 10.1007/s00424-011-0946-1. Epub 2011 Mar 18. Pflugers Arch. 2011. PMID: 21416260 Free PMC article. Review.
-
CRISPR gene editing in pluripotent stem cells reveals the function of MBNL proteins during human in vitro myogenesis.Hum Mol Genet. 2021 Dec 17;31(1):41-56. doi: 10.1093/hmg/ddab218. Hum Mol Genet. 2021. PMID: 34312665 Free PMC article.
-
Phosphorylation at Serines 157 and 161 Is Necessary for Preserving Cardiac Expression Level and Functions of Sarcomeric Z-Disc Protein Telethonin.Front Physiol. 2021 Sep 8;12:732020. doi: 10.3389/fphys.2021.732020. eCollection 2021. Front Physiol. 2021. PMID: 34566695 Free PMC article.
References
-
- Valle G., Faulkner G., De Antoni A., Pacchioni B., Pallavicini A., Pandolfo D., Tiso N., Toppo S., Trevisan S., Lanfranchi G. Telethonin, a novel sarcomeric protein of heart and skeletal muscle. FEBS Lett. 1997;415:163–168. doi:10.1016/S0014-5793(97)01108-3. - DOI - PubMed
-
- Faulkner G., Pallavicini A., Comelli A., Salamon M., Bortoletto G., Ievolella C., Trevisan S., Kojic S., Dalla Vecchia F., Laveder P., et al. FATZ, a filamin-, actinin-, and telethonin-binding protein of the Z-disc of skeletal muscle. J. Biol. Chem. 2000;275:41234–41242. doi:10.1074/jbc.M007493200. - DOI - PubMed
-
- Furukawa T., Ono Y., Tsuchiya H., Katayama Y., Bang M.L., Labeit D., Labeit S., Inagaki N., Gregorio C.C. Specific interaction of the potassium channel beta-subunit minK with the sarcomeric protein T-cap suggests a T-tubule-myofibril linking system. J. Mol. Biol. 2001;313:775–784. doi:10.1006/jmbi.2001.5053. - DOI - PubMed
-
- Markert C.D., Ning J., Staley J.T., Heinzke L., Childers C.K., Ferreira J.A., Brown M., Stoker A., Okamura C., Childers M.K. TCAP knockdown by RNA interference inhibits myoblast differentiation in cultured skeletal muscle cells. Neuromuscul. Disord. 2008;18:413–422. doi:10.1016/j.nmd.2008.03.010. - DOI - PubMed
-
- Mayans O., van der Ven P.F., Wilm M., Mues A., Young P., Furst D.O., Wilmanns M., Gautel M. Structural basis for activation of the titin kinase domain during myofibrillogenesis. Nature. 1998;395:863–869. doi:10.1038/27603. - DOI - PubMed
Publication types
MeSH terms
Substances
Grants and funding
LinkOut - more resources
Full Text Sources
Other Literature Sources
Molecular Biology Databases
Research Materials
