. 2010 May;95(5):2433-42.
doi: 10.1210/jc.2010-0023. Epub 2010 Mar 16.

Differential expression profile of growth hormone/chorionic somatomammotropin genes in placenta of small- and large-for-gestational-age newborns

Affiliations

Differential expression profile of growth hormone/chorionic somatomammotropin genes in placenta of small- and large-for-gestational-age newborns

Jaana Männik et al. J Clin Endocrinol Metab. 2010 May.

Abstract

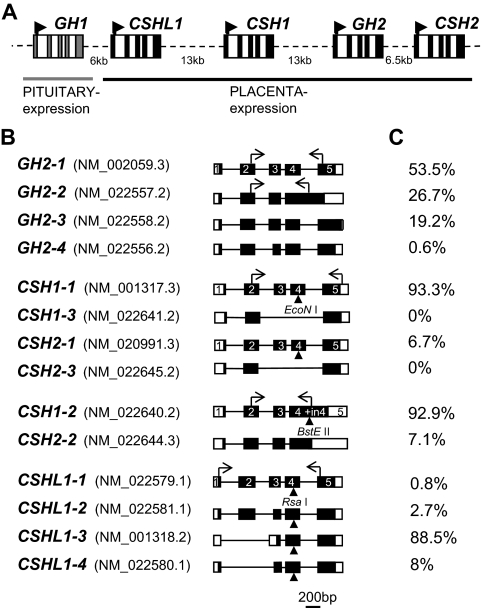
Context: The human growth hormone/chorionic somatomammotropin (hGH/CSH) locus at 17q22-24, consisting of one pituitary-expressed postnatal (GH1) and four placenta-expressed genes (GH2, CSH1, CSH2, and CSHL1), is implicated in regulation of postnatal and intrauterine growth. A positive correlation has been reported between the offspring's birth weight and serum placental GH (coded by GH2) and placental lactogen (coded by CSH1, CSH2) levels in pregnant women.

Objective: The objective of the study was the investigation of the hypothesis that the mRNA expression profile of placental hGH/CSH genes contributes to the determination of birth weight.

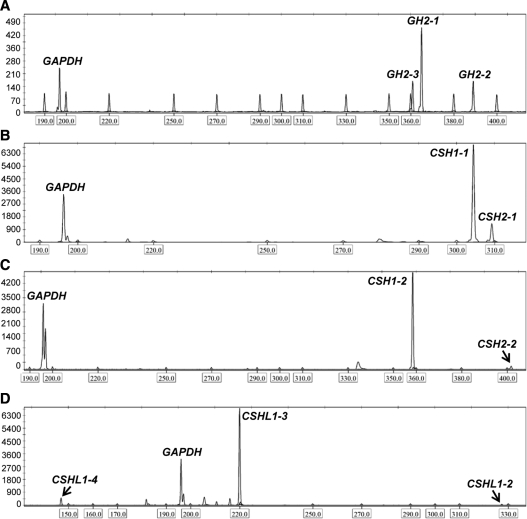
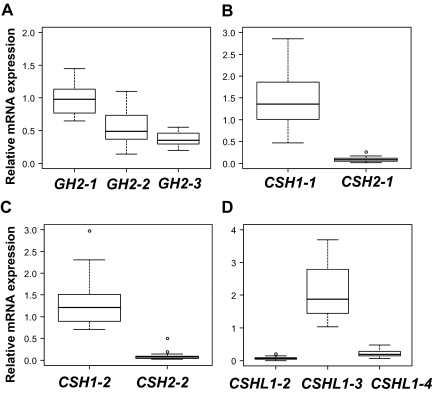
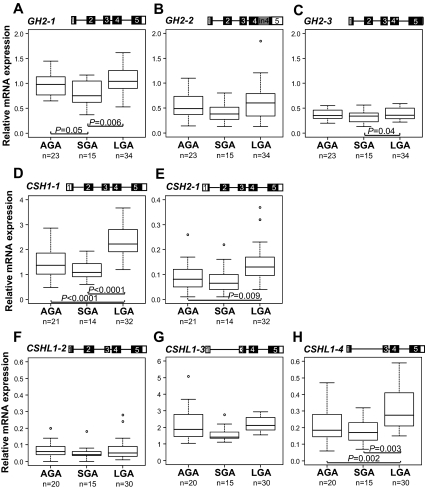
Design and subjects: We developed a sensitive, fluorescent-labeled semiquantitative RT-PCR assay coupled with gene-specific restriction analysis, capable of distinguishing alternative splice-products of individual placental hGH/CSH genes and quantification of their relative expression levels. The detailed profile of alternative transcripts of GH2, CSH1, CSH2, and CSHL1 genes in placenta from uncomplicated term pregnancies of the REPROMETA sample collection was addressed in association with the birth weight of newborns, grouped as appropriate for gestational age (AGA; n = 23), small for gestational age (SGA; n = 15), and large for gestational age (LGA; n = 34).

Results: The majority of pregnancies with SGA newborn showed down-regulation of the entire hGH/CSH cluster in placenta, whereas in the case of LGA, the expression of CSH1-1, CSH2-1, and CSHL1-4 mRNA transcripts in placenta was significantly increased compared with AGA newborns (P < 0.0001, P = 0.009, P = 0.002, respectively).

Conclusion: The expression profile of placental hGH/CSH genes in placenta is altered in pregnancies accompanied by SGA and LGA compared with AGA newborns, and thus, it may directly affect the circulating fetal and maternal placental GH and placental lactogen levels.


Figures

Figure 1
Figure 1
Organization of human GH/CSH genes in chromosome 17q22-24 and alternatively spliced transcripts of placental genes. A, Schematic representation of the hGH/CSH gene cluster. Rectangles represent each of the five genes (five exons highlighted by colored boxes), and dashed lines denote intergenic regions. The arrowheads indicate the start and direction of transcription. B, Alternatively spliced transcripts of GH2, CSH1, CSH2, and CSHL1 are drawn to approximate scale and are combined according to assay design into four groups. Exons are shown as boxes and introns as lines. The coding region is denoted by black-filled area. Exon numbers are marked according to the main transcripts of GH2 and CSH1. The horizontal arrows indicate the binding sites for the RT-PCR primers. The vertical arrowheads indicate the gene-specific restriction enzyme recognition sites for EcoNI (for CSH1 and CSH2), BstEII (for CSH1-2/CSH2-2), and RsaI (for CSHL1). The National Center for Biotechnology Information GenBank accession number for each alternative mRNA transcript is indicated in parentheses. C, The relative abundance of each gene alternative mRNA transcripts analyzed by semiquantitative RT-PCR and gene-specific restriction detected on an ABI 3130XL genetic analyzer (see examples on Fig. 2).
Figure 2
Figure 2
GeneMapper version 4.0 electropherogram showing the amplified DNA fragments of fluorescent-labeled (6-FAM, HEX) reference gene (GAPDH) and alternative mRNA transcripts of placental hGH/CSH genes in term placenta. The expression of the genes was assessed by semiquantitative RT-PCR (GAPDH, GH2) or RT-PCR combined with further gene-specific restriction analysis (CSH1, CSH2, and CSHL1), which were afterward resolved using ABI 3130XL genetic analyzer. The x-axis shows the size of the detected fragments in base pairs, and the y-axis represents the signal intensity in relative fluorescent units. Boxed numbers below the x-axis mark the peaks of the internal size standard. The peaks corresponding to the amplicons from the reference gene GAPDH (196 bp) are shown on all panels. The peaks representing the amplified DNA fragments of the major transcripts of the studied hGH/CSH genes are shown on subpanels GH2-1 (364 bp), GH2-2 (390 bp), GH2-3 (360 bp) (A); CSH1-1 (304 bp), CSH2-1 (309 bp) (B); CSH1-2 (358 bp), CSH2-2 (401 bp) (C); and CSHL1-2 (326 bp), CSHL1-3 (220 bp) and CSHL1-4 (147 bp) (D).
Figure 3
Figure 3
Relative expression level of major alternative mRNA transcripts of GH2, CSH1, CSH2, and CSHL1 genes in term placentas from pregnancies resulting in the birth of AGA newborns (n = 23). The relative expression is given as ratio to the reference gene GAPDH. The boxes represent the 25th and 75th percentiles. The median is denoted as the line that bisects the boxes. The whiskers are lines extending from each end of the box covering the extent of the data on 1.5 X interquartile range. Circles represent the outlier values. A, GH2 mRNA transcripts. B, CSH1-1 and CSH2-1. C, CSH1-2 and CSH2-1. D, CSHL1 mRNA transcripts.
Figure 4
Figure 4
Comparison of relative expression levels of major alternatively spliced mRNA transcripts of GH2 (A–C), CSH1 (D), CSH2 (E), and CSHL1 (F–H) among term placentas from pregnancies resulting in the birth of AGA, SGA, and LGA newborns. The corresponding transcript representing the presented data are shown on the top of each panel. An asterisk denotes the 4-bp deletion in exon 4 of GH2-3. Relative expression of each transcript is given as ratio to the reference gene GAPDH. The boxes represent the 25th and 75th percentiles. The median is denoted as the line that bisects the boxes. The whiskers are lines extending from each end of the box covering the extent of the data on 1.5 × interquartile range. Circles represent the outlier values. Plotted values are presented without covariate adjustment. Statistical differences between study groups were assessed by ANCOVA using Bonferroni correction. Statistical tests were adjusted for gestational age as well as mother’s prepregnancy BMI, weight gain, and smoking during pregnancy. P values reflecting significant differences (P < 0.05) are shown.

Comment in

References

    1. George DL, Phillips 3rd JA, Francke U, Seeburg PH 1981 The genes for growth hormone and chorionic somatomammotropin are on the long arm of human chromosome 17 in region q21 to qter. Hum Genet 57:138–141 - PubMed
    1. Handwerger S, Freemark M 2000 The roles of placental growth hormone and placental lactogen in the regulation of human fetal growth and development. J Pediatr Endocrinol Metab 13:343–356 - PubMed
    1. Barsh GS, Seeburg PH, Gelinas RE 1983 The human growth hormone gene family: structure and evolution of the chromosomal locus. Nucleic Acids Res 11:3939–3958 - PMC - PubMed
    1. Chen EY, Liao YC, Smith DH, Barrera-Saldaña HA, Gelinas RE, Seeburg PH 1989 The human growth hormone locus: nucleotide sequence, biology, and evolution. Genomics 4:479–497 - PubMed
    1. Hirt H, Kimelman J, Birnbaum MJ, Chen EY, Seeburg PH, Eberhardt NL, Barta A 1987 The human growth hormone gene locus: structure, evolution, and allelic variations. DNA 6:59–70 - PubMed

Publication types