. 2010 Apr 15;123(Pt 8):1235-46.
doi: 10.1242/jcs.061903. Epub 2010 Mar 16.

Ephrin-B2 regulates endothelial cell morphology and motility independently of Eph-receptor binding

Affiliations

Ephrin-B2 regulates endothelial cell morphology and motility independently of Eph-receptor binding

Magdalena L Bochenek et al. J Cell Sci. .

Abstract

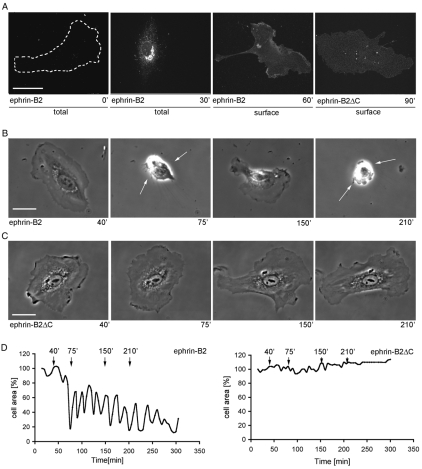
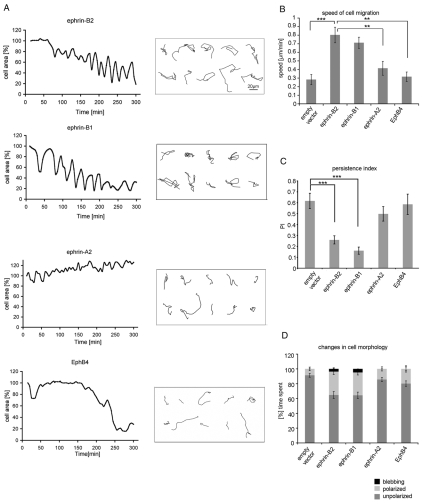
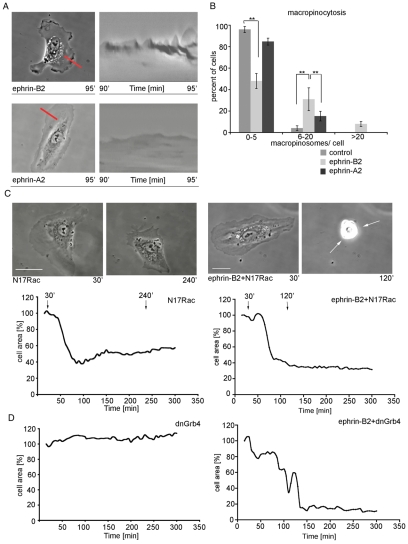
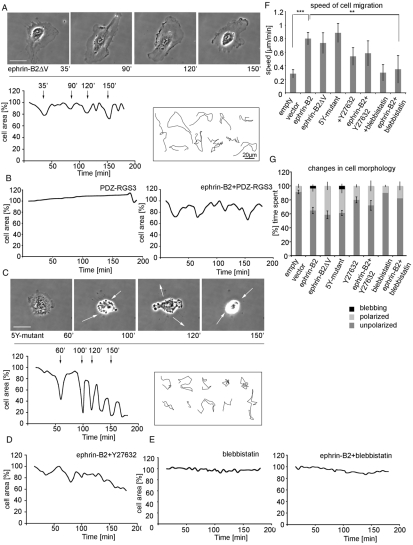
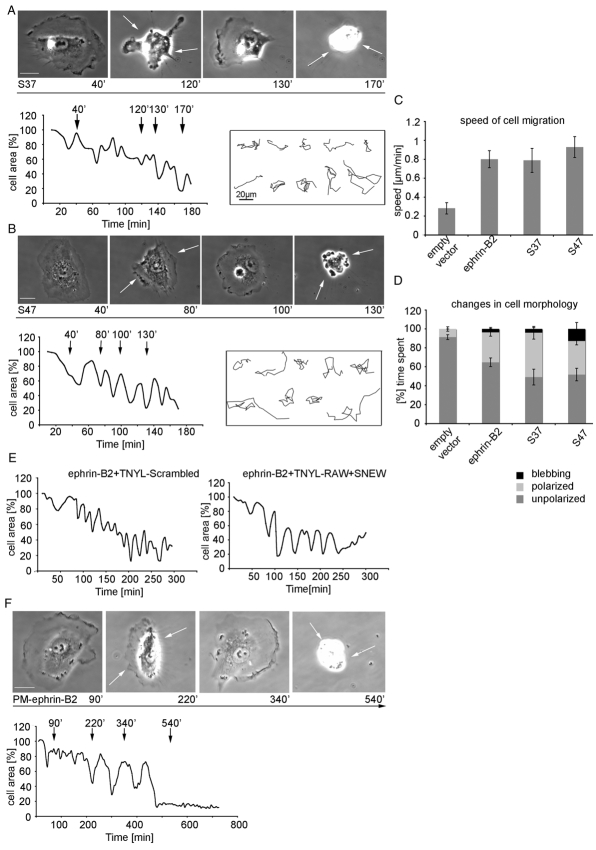
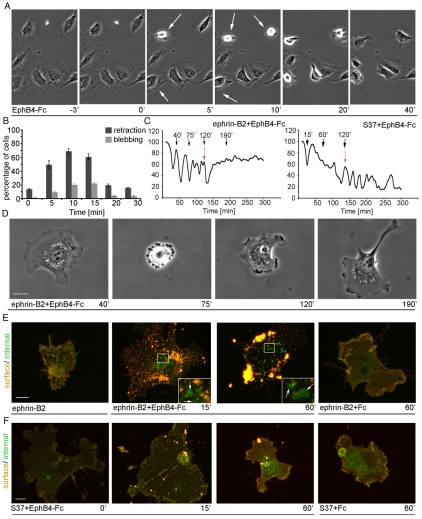
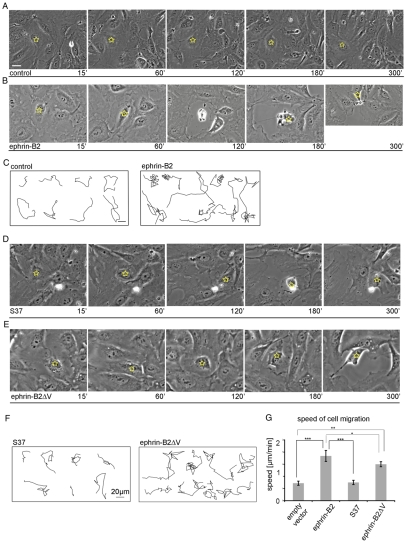
The transmembrane protein ephrin-B2 regulates angiogenesis, i.e. the formation of new blood vessels through endothelial sprouting, proliferation and remodeling processes. In addition to essential roles in the embryonic vasculature, ephrin-B2 expression is upregulated in the adult at sites of neovascularization, such as tumors and wounds. Ephrins are known to bind Eph receptor family tyrosine kinases on neighboring cells and trigger bidirectional signal transduction downstream of both interacting molecules. Here we show that ephrin-B2 dynamically modulates the motility and cellular morphology of isolated endothelial cells. Even in the absence of Eph-receptor binding, ephrin-B2 stimulates repeated cycling between actomyosin-dependent cell contraction and spreading episodes, which requires the presence of the C-terminal PDZ motif. Our results show that ephrin-B2 is a potent regulator of endothelial cell behavior, and indicate that the control of cell migration and angiogenesis by ephrins might involve both receptor-dependent and receptor-independent activities.


Figures

Fig. 1.
Fig. 1.
Constitutive ephrin-B2 expression stimulates repeated morphology switches. (A) Subconfluent cells were injected with pRK5-ephrin-B2 or pRK5-ephrin-B2ΔC (200 μg/ml; n=10), fixed and stained for ephrin-B2 total (with cell permeabilization) or surface expression (without cell permeabilization). (B,C) Stills taken from time-lapse movies (collected for 5 hours at 1 frame every 30 seconds) of (B) ephrin-B2- and (C) ephrin-B2ΔC-injected HUVECs, at different time-points. (D) Using Volocity software, changes in cell area, at 5-minute intervals, were measured and graphed. Measurements (at the times indicated) that correspond to movie stills in B and C are marked with arrows in D. HUVECsEfnB2 showed continuous switches between a retracted and a spread state. Scale bars: 20 μm.
Fig. 2.
Fig. 2.
Cell contraction-expansion cycling and increased migration is ephrin-B specific. The changes in area, morphology and migration tracks of 10 injected cells were analyzed using Volocity software, between 10 minutes and 5 hours after cell microinjection. (A) Injected cells were manually traced at 5-minute intervals and the area of the ‘foot-print’ of the cells was measured and graphed. (B) By following the nuclei of cells, migration tracks (boxed area in A) were made between 10 minutes and 3 hours and migration speed calculated. (C) Persistence index (PI) is a measure of how directed migration is, and was calculated from the distance between the first and the last point of the tracked cell's nucleus divided by the total distance traveled. (D) The time the injected cells spend in three different morphological states: unpolarized (without polarized lamellae), polarized (with a distinct leading edge and a trailing tail) and blebbing (showing membrane blebbing) was quantified from the time-lapse movies and graphed as a percentage of the total time of analysis. Error bars indicate ± s.e.m. Statistical analysis was performed using the Student's t-test (***P<0.001; **P<0.01). Scale bar: 20 μm.
Fig. 3.
Fig. 3.
HUVECsEfnB2 exhibit increased Rac- and Grb4-dependent membrane ruffling. For kymographic analysis (A) time-lapse movies were taken before and after expression of injected constructs, for 5 minutes at 1 frame per second (n=2) and four different regions of the cell periphery were analyzed for each cell. For the macropinocytosis assay (B), isolated HUVECs were either uninjected or injected with ephrin-B2 (200 μg/ml) or ephrin-A2 (200 μg/ml) and left for 3 hours, after which the culture medium was replaced with medium containing 2 mg/ml RITC-dextran for 5 minutes before the cells were fixed. (C) Stills taken from time-lapse movies and (D) cell area changes of subconfluent cells injected with either dominant negative Rac (N17Rac; 300 μg/ml) or dominant negative Grb4 (dnGrb4; 300 μg/ml) and those that were also co-injected with ephrin-B2 (200 μg/ml). Error bars indicate ± s.e.m. Statistical analysis was performed using the Student's t-test (**P<0.01). Scale bars: 20 μm.
Fig. 4.
Fig. 4.
The PDZ-binding domain is necessary for cell retraction and membrane blebbing. (A) Subconfluent HUVECs were injected with ephrin-B2ΔV (200 μg/ml), (B) co-injected with ephrin-B2 and PDZ-RGS3 (200 μg/ml and 300 μg/ml, respectively, n=5) or (C) injected with ephrin-B2-5Y-mutant (200 μg/ml). (D,E) HUVECsEfnB2 were treated with either Y27632 (20 μM; D) or with blebbistatin (100 μM; E). Time-lapse movies were collected for 3 hours at a rate of one frame every 30 seconds. (F) Using Volocity software changes in cell area and cell migration tracks for each treatment were analyzed and migration speed calculated. (G) The time the injected cells spent in three different morphological states (unpolarized, polarized and blebbing) was quantified from time-lapse movies and graphed as a percentage of the total time of analysis. This revealed that cells expressing the 5Y-mutant also had retraction-protrusion oscillations like HUVECsEfnB2 (C,G). Episodes of severe retraction and membrane blebbing were not observed in ephrin-B2ΔV-injected cells (A) or in the cells co-injected with ephrin-B2 and PDZ-RGS3 (B). Retraction and membrane blebbing also requires ROCK (D) and actomyosin contraction (E). Error bars indicate ± s.e.m. Statistical analysis was performed using the Student's t-test (***P<0.001; **P<0.01). Scale bars: 20 μm.
Fig. 5.
Fig. 5.
Cell morphology oscillations and increased migration speed of HUVECEfnB2 are independent of EphB-receptor binding. (A,B,E,F) Subconfluent cells were injected with either ephrin-B2 binding mutants S37 (200 μg/ml; A) or S47 (200 μg/ml; B), or with ephrin-B2 (200 μg/ml; E) and treated with TNYL-RAW (50 μM) or a combination of TNYL-RAW with SNEW (75 μM each) or injected with PM-ephrin-B2 (400 μg/ml; F). Time-lapse movies were collected either for 3 hours (S37, S47, ephrin-B2 treated with peptide) or for 12 hours (PM-ephrin-B2 mutant) at a rate of 1 frame every 30 seconds. Using Volocity software the cell area was measured and graphed. (C) By following the nuclei of injected cells their migration tracks were recorded and migration speed was quantified. (D) The time the injected cells spend in three different morphological states (unpolarized, polarized and blebbing) was quantified from time-lapse movies and graphed as a percentage of the total time of analysis. Error bars indicate ± s.e.m. Scale bars: 20 μm.
Fig. 6.
Fig. 6.
Internalization of ephrin-B2 inhibits morphology switches. (A) Phase-contrast time-lapse stills of HUAECs stimulated with pre-clustered EphB4-Fc (5 μg/ml). Following stimulation the cells can be seen to retract (5 minutes and 10 minutes; indicated by white arrows). Within 20 minutes, cell retraction is rapidly reversed. (B) The number of retracted and blebbing cells upon stimulation with EphB4-Fc, was scored, at the indicated time-points, and graphed. (C,E,F) Subconfluent HUVECs were microinjected with ephrin-B2 (200 μg/ml; C,E) or with S37 (200 μg/ml; C and F) and allowed to express for 2 hours. The cells were stimulated with EphB4-Fc (1 μg/ml, preclustered with 10 μg/ml IgG) and fixed after 0, 15 or 60 minutes, as indicated. Ephrin-B2 was detected using goat anti-ephrin-B2 antibodies. Cy3-labeled donkey anti-goat was used to detect both external and internal ephrin-B2. FITC-labeled donkey anti-goat was used to detect external ephrin-B2 after permeabilization (E,F). (D) Stills from time-lapse movies collected for 5 hours at 1 frame every 30 seconds. 2 hours post-injection cells were treated with pre-clustered EphB4-Fc (1 μg/ml; C,D) at the times indicated by red arrows in C). Using Volocity software the cell area of a microinjected and EphB4-Fc treated cells was measured and graphed. Error bars indicate ±s.e.m. Scale bars: 10 μm.
Fig. 7.
Fig. 7.
Increased migration of HUVECsEfnB2 within a cell monolayer. Stills taken from time-lapse movies of either (A) control-injected cells, (B) HUVECsEfnB2, (D) S37-expressing cells or (E) ephrin-B2ΔV-expressing cells. HUVECsEfnB2 underwent changes in cell shape retracting (B, 120 minutes) and respreading (B, 180 minutes). Time-lapse movies were collected for 5 hours at a rate of 1 frame per 30 seconds. At the end of each movie the cells were fixed and the expression of ephrin-B2 was examined by immunocytochemistry. (C,F,G) Using Volocity software cell migration tracks and speed were quantified. HUVECsEfnB2 and HUVECs expressing ephrin-B2ΔV migrated more within the monolayer than did control injected cells, over 5 hours. Error bars indicate ±s.e.m. Statistical analysis was performed using the Student's t-test (***P<0.001; **P<0.01; *P<0.05). Scale bars: 20 μm.

Similar articles

Cited by

References

    1. Adams R. H., Wilkinson G. A., Weiss C., Diella F., Gale N. W., Deutsch U., Risau W., Klein R. (1999). Roles of ephrinB ligands and EphB receptors in cardiovascular development: demarcation of arterial/venous domains, vascular morphogenesis, and sprouting angiogenesis. Genes Dev. 13, 295-306 - PMC - PubMed
    1. Brantley-Sieders D. M., Chen J. (2004). Eph receptor tyrosine kinases in angiogenesis: from development to disease. Angiogenesis 7, 17-28 - PubMed
    1. Bruckner K., Pablo Labrador J., Scheiffele P., Herb A., Seeburg P. H., Klein R. (1999). EphrinB ligands recruit GRIP family PDZ adaptor proteins into raft membrane microdomains. Neuron 22, 511-524 - PubMed
    1. Bush J. O., Soriano P. (2009). Ephrin-B1 regulates axon guidance by reverse signaling through a PDZ-dependent mechanism. Genes Dev. 23, 1586-1599 - PMC - PubMed
    1. Carvalho R. F., Beutler M., Marler K. J., Knoll B., Becker-Barroso E., Heintzmann R., Ng T., Drescher U. (2006). Silencing of EphA3 through a cis interaction with ephrinA5. Nat. Neurosci. 9, 322-330 - PubMed

Publication types