

Circulating microRNAs in plasma of patients with gastric cancers
- PMID: 20234369
- PMCID: PMC2853097
- DOI: 10.1038/sj.bjc.6605608
Circulating microRNAs in plasma of patients with gastric cancers
Abstract
Background: We examined plasma microRNA (miRNA) concentrations from patients with gastric cancers (GCs) to assess their clinical application for diagnosing and monitoring diseases.
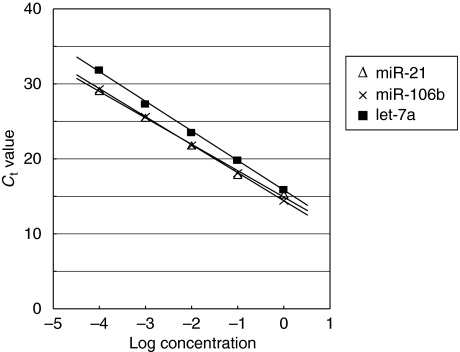
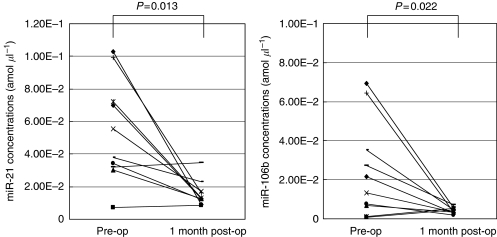
Methods: We initially investigated the appropriateness of plasma miRNA assay, and then compared plasma miRNA results with the expressions in cancer tissues from eight GC patients, and also compared plasma miRNAs between pre- and post-operative paired samples from 10 GC patients. Then, plasma miRNAs (miR-17-5p, miR-21, miR-106a, miR-106b and let-7a) were analysed in 69 GC patients and 30 healthy volunteers in total.
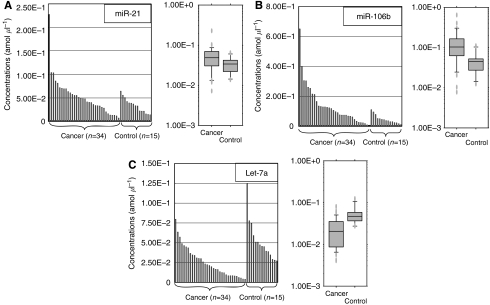
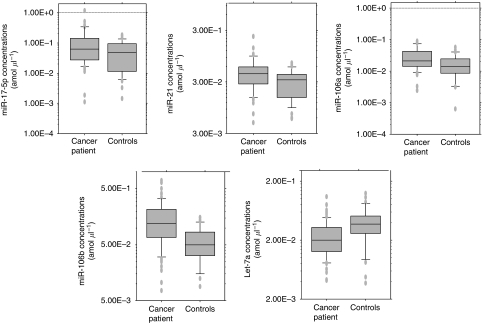
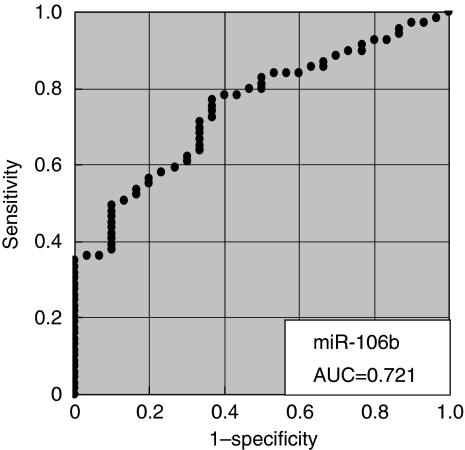
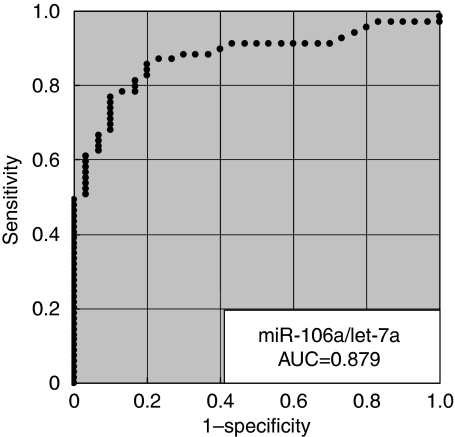
Results: The initial analysis showed that miRNAs were stable and detectable in all plasma samples, and the plasma miRNA levels reflected the tumour miRNAs in most cases. The levels of these miRNAs were significantly reduced in post-operative samples. In large-scale analysis, the plasma concentrations of miRNAs (miR-17-5p, miR-21, miR-106a, miR-106b) were significantly higher in GC patients than controls (P=0.05, 0.006, 0.008 and <0.001 respectively), whereas let-7a was lower in GC patients (P=0.002). The values of the area under the receiver-operating characteristic curve were 0.721 for the miR-106b assay and 0.879 for the miR-106a/let-7a ratio assay.
Conclusion: Detection of circulating miRNAs might provide new complementary tumour markers for GC.
Figures
Similar articles
-
Prognostic impact of circulating miR-21 in the plasma of patients with gastric carcinoma.Anticancer Res. 2013 Jan;33(1):271-6. Anticancer Res. 2013. PMID: 23267156
-
miRNA-199a-3p in plasma as a potential diagnostic biomarker for gastric cancer.Ann Surg Oncol. 2013 Dec;20 Suppl 3:S397-405. doi: 10.1245/s10434-012-2600-3. Epub 2012 Sep 7. Ann Surg Oncol. 2013. PMID: 22956063
-
Plasma miR-122 and miR-192 as potential novel biomarkers for the early detection of distant metastasis of gastric cancer.Oncol Rep. 2014 Apr;31(4):1863-70. doi: 10.3892/or.2014.3004. Epub 2014 Jan 28. Oncol Rep. 2014. PMID: 24481716
-
Circulating microRNAs as diagnostic and therapeutic biomarkers in gastric and esophageal cancers.J Cell Physiol. 2018 Nov;233(11):8538-8550. doi: 10.1002/jcp.26850. Epub 2018 Jun 19. J Cell Physiol. 2018. PMID: 29923196 Review.
-
The Three Paralogous MicroRNA Clusters in Development and Disease, miR-17-92, miR-106a-363, and miR-106b-25.Scientifica (Cairo). 2016;2016:1379643. doi: 10.1155/2016/1379643. Epub 2016 Apr 4. Scientifica (Cairo). 2016. PMID: 27127675 Free PMC article. Review.
Cited by
-
Expression of small nucleolar RNAs in leukemic cells.Cell Oncol (Dordr). 2013 Feb;36(1):55-63. doi: 10.1007/s13402-012-0113-5. Epub 2012 Nov 15. Cell Oncol (Dordr). 2013. PMID: 23229394
-
Circulating microRNAs as prognostic therapy biomarkers in head and neck cancer patients.Br J Cancer. 2015 Jun 30;113(1):76-82. doi: 10.1038/bjc.2015.111. Epub 2015 Jun 9. Br J Cancer. 2015. PMID: 26057452 Free PMC article.
-
Selective and sensitive detection of MiRNA-21 based on gold-nanorod functionalized polydiacetylene microtube waveguide.Biosens Bioelectron. 2016 Nov 15;85:198-204. doi: 10.1016/j.bios.2016.05.019. Epub 2016 May 6. Biosens Bioelectron. 2016. PMID: 27179561 Free PMC article.
-
MiRNAs and LincRNAs: Could they be considered as biomarkers in colorectal cancer?Int J Mol Sci. 2012;13(1):840-865. doi: 10.3390/ijms13010840. Epub 2012 Jan 16. Int J Mol Sci. 2012. PMID: 22312290 Free PMC article. Review.
-
Serum miR-26a as a diagnostic and prognostic biomarker in cholangiocarcinoma.Oncotarget. 2015 Jul 30;6(21):18631-40. doi: 10.18632/oncotarget.4072. Oncotarget. 2015. PMID: 26087181 Free PMC article.
References
-
- Anker P, Lyautey J, Lederrey C, Stroun M (2001) Circulating nucleic acids in plasma or serum. Clin Chim Acta 313: 143–146 - PubMed
-
- Calin GA, Croce CM (2006) MicroRNA signatures in human cancers. Nat Rev Cancer 6: 857–866 - PubMed
-
- Chan SH, Wu CW, Li AF, Chi CW, Lin WC (2008) miR-21 microRNA expression in human gastric carcinomas and its clinical association. Anticancer Res 28: 907–911 - PubMed
MeSH terms
Substances
LinkOut - more resources
Full Text Sources
Other Literature Sources
Medical
Miscellaneous
