

Cluster morphology analysis
- PMID: 20234799
- PMCID: PMC2838429
- DOI: 10.1016/j.sste.2009.08.002
Cluster morphology analysis
Abstract
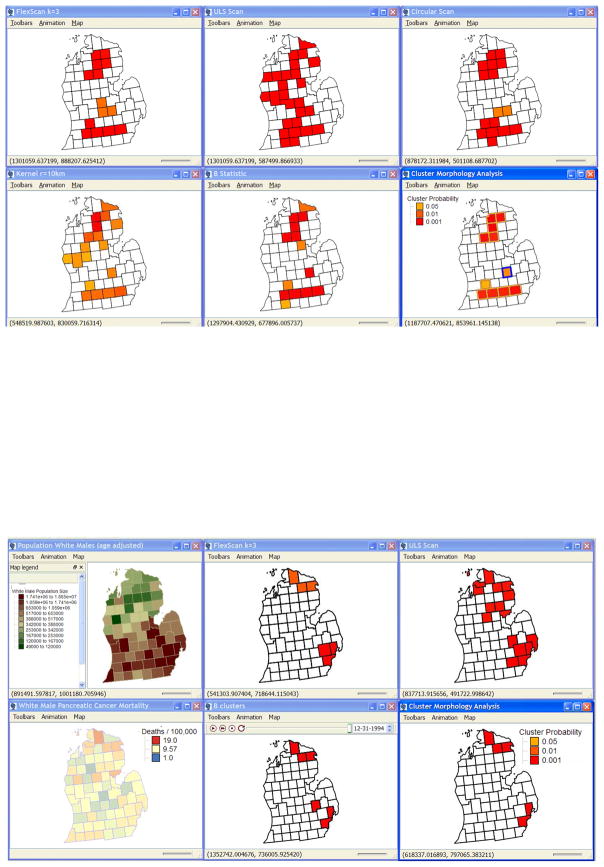
Most disease clustering methods assume specific shapes and do not evaluate statistical power using the applicable geography, at-risk population, and covariates. Cluster Morphology Analysis (CMA) conducts power analyses of alternative techniques assuming clusters of different relative risks and shapes. Results are ranked by statistical power and false positives, under the rationale that surveillance should (1) find true clusters while (2) avoiding false clusters. CMA then synthesizes results of the most powerful methods. CMA was evaluated in simulation studies and applied to pancreatic cancer mortality in Michigan, and finds clusters of flexible shape while routinely evaluating statistical power.
Keywords: Clustering methods; medical geography; meta-analysis; statistical power.
Figures


Similar articles
-
Spatial distribution and clusters of pancreatic cancer mortality in Shandong Province, China.Sci Rep. 2019 Sep 9;9(1):12917. doi: 10.1038/s41598-019-49357-w. Sci Rep. 2019. PMID: 31501496 Free PMC article.
-
Local bladder cancer clusters in southeastern Michigan accounting for risk factors, covariates and residential mobility.PLoS One. 2015 Apr 9;10(4):e0124516. doi: 10.1371/journal.pone.0124516. eCollection 2015. PLoS One. 2015. PMID: 25856581 Free PMC article.
-
Cluster-level statistical inference in fMRI datasets: The unexpected behavior of random fields in high dimensions.Magn Reson Imaging. 2018 Jun;49:101-115. doi: 10.1016/j.mri.2018.01.004. Epub 2018 Feb 3. Magn Reson Imaging. 2018. PMID: 29408478 Free PMC article.
-
Folic acid supplementation and malaria susceptibility and severity among people taking antifolate antimalarial drugs in endemic areas.Cochrane Database Syst Rev. 2022 Feb 1;2(2022):CD014217. doi: 10.1002/14651858.CD014217. Cochrane Database Syst Rev. 2022. PMID: 36321557 Free PMC article.
-
Subgroup analyses in randomised controlled trials: quantifying the risks of false-positives and false-negatives.Health Technol Assess. 2001;5(33):1-56. doi: 10.3310/hta5330. Health Technol Assess. 2001. PMID: 11701102 Review.
Cited by
-
On the effect of diagnostic misclassification bias on the observed spatial pattern in regional count data--a case study using West Nile virus mortality data from Ontario, 2005.Spat Spatiotemporal Epidemiol. 2010 Jul;1(2-3):117-22. doi: 10.1016/j.sste.2010.03.004. Epub 2010 Mar 20. Spat Spatiotemporal Epidemiol. 2010. PMID: 22749468 Free PMC article.
-
Factors Associated with Dietary Patterns in Colombia.Nutrients. 2023 Apr 26;15(9):2079. doi: 10.3390/nu15092079. Nutrients. 2023. PMID: 37432184 Free PMC article.
-
Spatial heterogeneity of type I error for local cluster detection tests.Int J Health Geogr. 2014 May 27;13:15. doi: 10.1186/1476-072X-13-15. Int J Health Geogr. 2014. PMID: 24885343 Free PMC article.
-
Cluster Detection Tests in Spatial Epidemiology: A Global Indicator for Performance Assessment.PLoS One. 2015 Jun 18;10(6):e0130594. doi: 10.1371/journal.pone.0130594. eCollection 2015. PLoS One. 2015. PMID: 26086911 Free PMC article.
-
Geographic disparities and temporal changes in risk of death from myocardial infarction in Florida, 2000-2014.BMC Public Health. 2019 May 3;19(1):505. doi: 10.1186/s12889-019-6850-x. BMC Public Health. 2019. PMID: 31053068 Free PMC article.
References
-
- Abe T, I, Martin B, Roche LM. Clusters of census tracts with high proportions of men with distant-stage prostate cancer incidence in New Jersey, 1995 to 1999. Am J Prev Med. 2006;30(2 Suppl):S60–66. - PubMed
-
- Anselin L. Local indicators of spatial association-LISA. Geographical Analysis. 1995;27:93–115.
-
- Besag J, Newell J. The detection of clusters in rare diseases. Journal of the Royal Statistical Society Series A. 1991;154:143–155.
Publication types
MeSH terms
Grants and funding
LinkOut - more resources
Full Text Sources
Medical
